Understanding Your Dashboard
Dashboard Overview
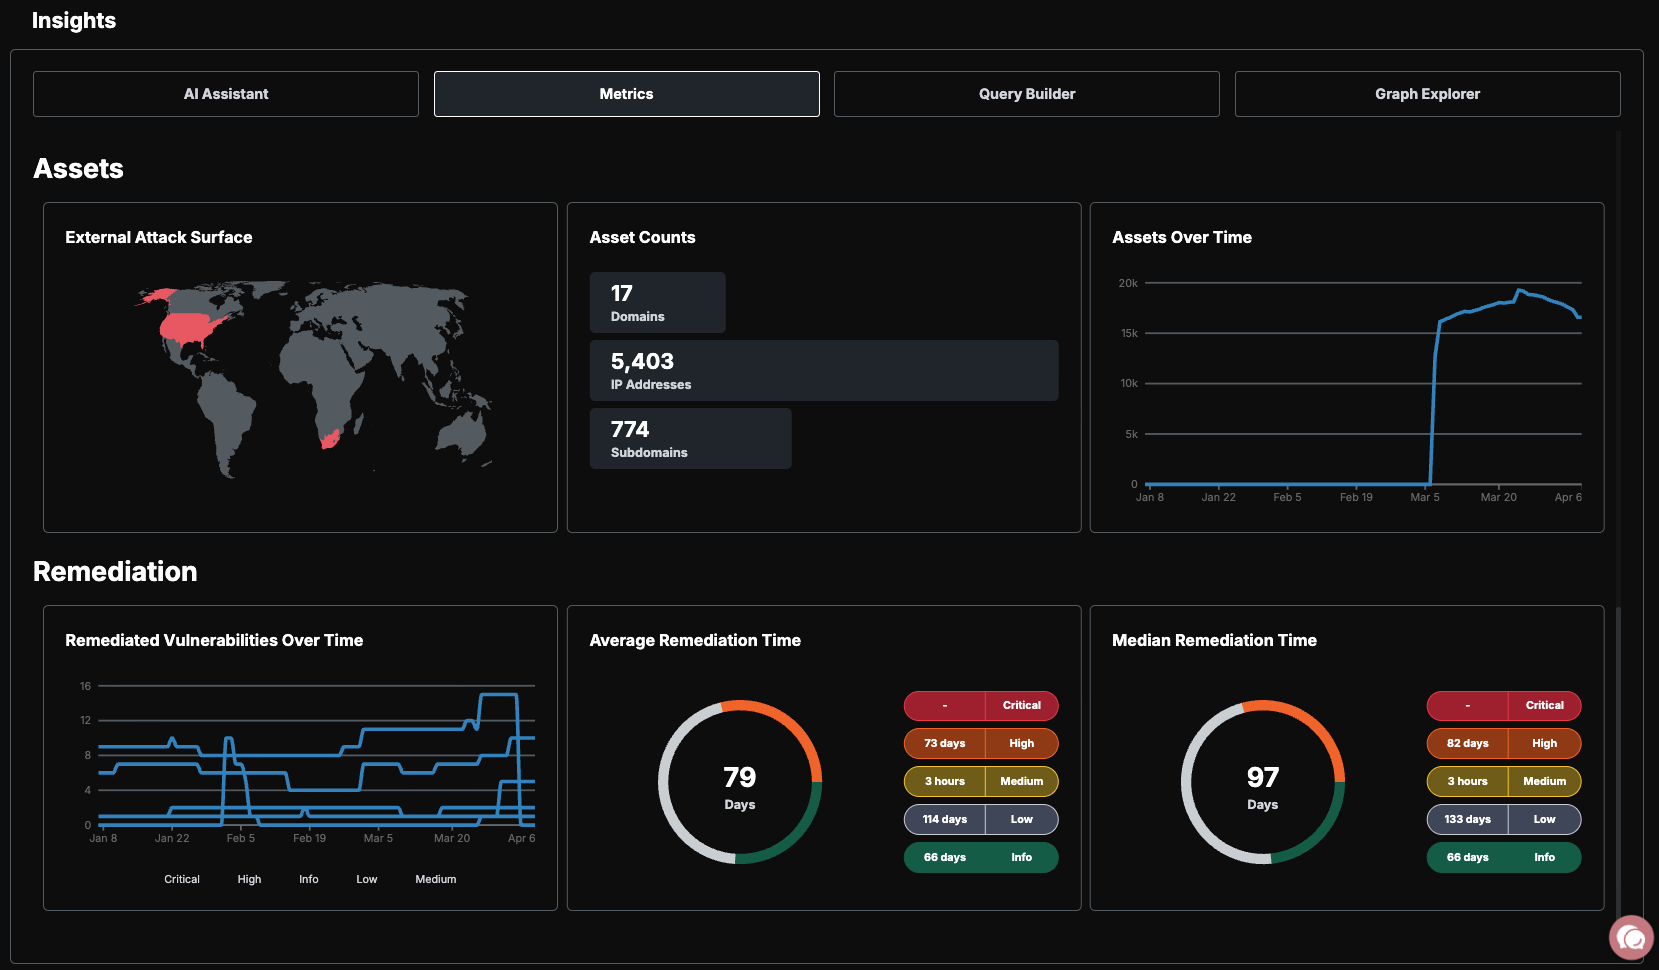
The dashboard gives you a real-time view of your security posture. At a glance, you can see how many assets are in your attack surface, where your highest risks are, and what scans are currently running.
Key metrics at a glance:
Asset count — Total assets broken down by type and status
Risk breakdown — Vulnerabilities organized by severity
Scan activity — Active jobs, completed scans, and discovery timeline
Key Metrics
Asset Count
Your asset count is broken down by type (domains, IPs, cloud resources, certificates, and more) and by status (Pending, Active, Frozen, Deleted). This tells you exactly what is in scope and being monitored.
Risk Breakdown
Risks are categorized by severity using CVSS scores:
Scan Activity
The scan activity section shows active jobs currently running, recently completed scans, and a discovery timeline that tracks how your attack surface has changed over time.
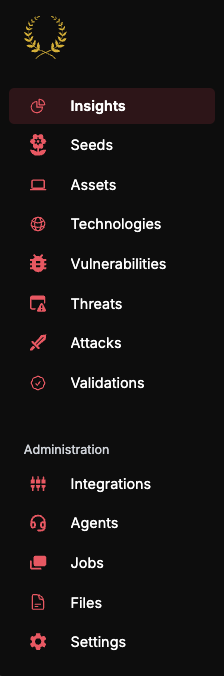
Navigation
The left sidebar is your primary navigation. Each section serves a specific purpose:
Asset States
Every asset in the platform has a status that controls whether it is scanned and monitored:
New assets from discovery start as Pending. You promote them to Active to begin scanning. If you need to temporarily stop scanning an asset without removing it, set it to Frozen. Deleted assets are permanently removed from your inventory.
Risk States
Risks follow a lifecycle that tracks them from discovery through resolution:
The standard lifecycle is Detected → Demonstrated → Resolved. When Guard detects a vulnerability, it moves to the Demonstrated state once Praetorian engineers confirm it is a true positive that represents genuine risk to your organization. Once the underlying issue is fixed, mark it as Remediated. If a previously remediated risk is re-detected in a subsequent scan, it will automatically reopen as Demonstrated.
What's Next
Navigating the Platform — Learn how to use each section in depth
Risk Lifecycle Deep Dive — Understand the full risk management workflow
AI Features — Get the most out of the AI Chat interface