Quick Start Guide
Step 1: Log In and Orient Yourself
Open your browser and navigate to guard.praetorian.com.
Enter the credentials provided by your Praetorian team and sign in.
You will land on the Insights page (with the Marcus Aurelius interface front and center), your central command center.
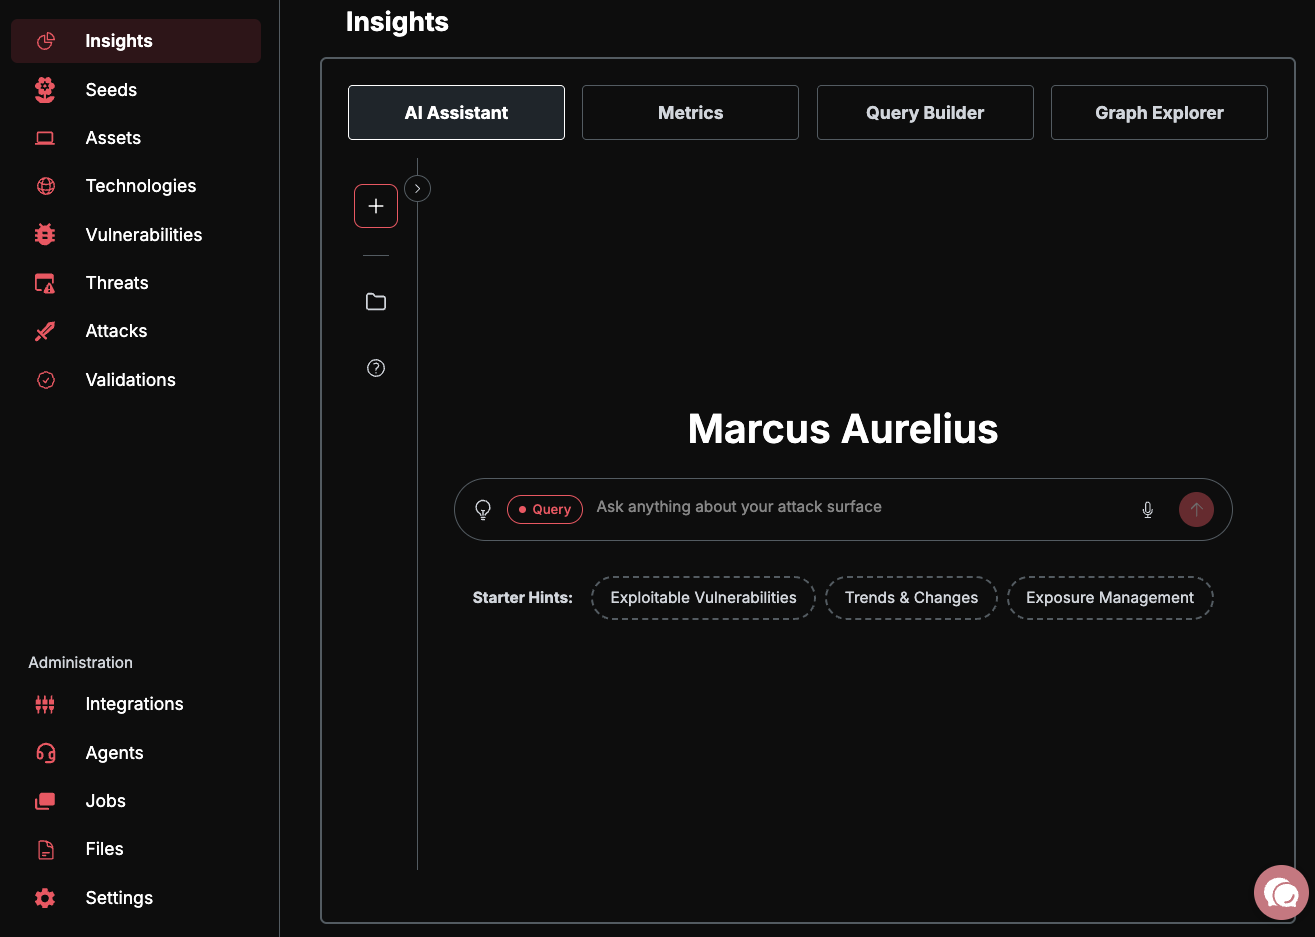
Take a moment to orient yourself with the key areas of the platform:
Assets — Your complete external attack surface: domains, IPs, cloud resources, and more.
Risks — Vulnerabilities and security findings discovered across your assets.
Integrations — Connect your existing security tools and cloud accounts.
Settings — Manage your organization, users, and platform configuration.
AI Chat — Ask questions about your attack surface in natural language.
For a detailed breakdown of each section, see Understanding Your Dashboard.
Step 2: Add Your First Seed
Seeds are the starting points for Guard's automated discovery. You provide a root domain, IP range, or cloud account, and Guard expands outward to map your entire attack surface.
Navigate to Assets in the sidebar.
Click the "Add Seed" button.
Enter a root domain (e.g.,
yourcompany.com), an IP range (e.g.,203.0.113.0/24), or a cloud account identifier.Click Add Seeds to begin discovery.
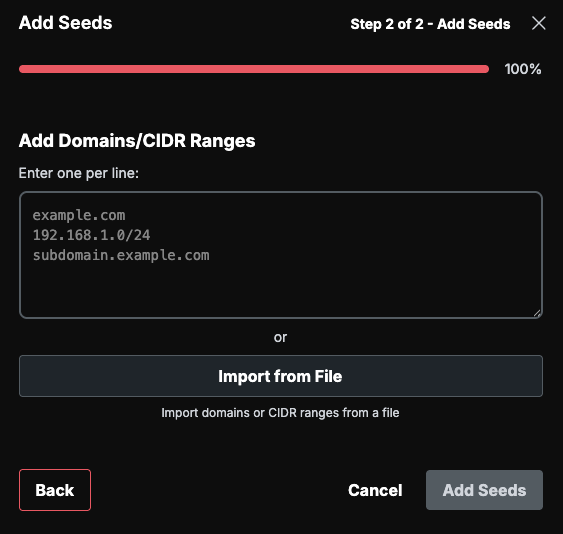
Once saved, Guard immediately begins discovering subdomains, IP addresses, and related assets automatically. Initial discovery typically takes 15–60 minutes depending on the size of your attack surface.
For bulk imports, additional seed types (IPv6, CIDR ranges, repositories), and integration-based seeding, see Adding Your First Seeds.
Step 3: Review Your First Risks
Navigate to Risks in the sidebar.
Guard automatically scans every discovered asset using 87+ security capabilities, including vulnerability scanners, misconfig detectors, and exposure checks.
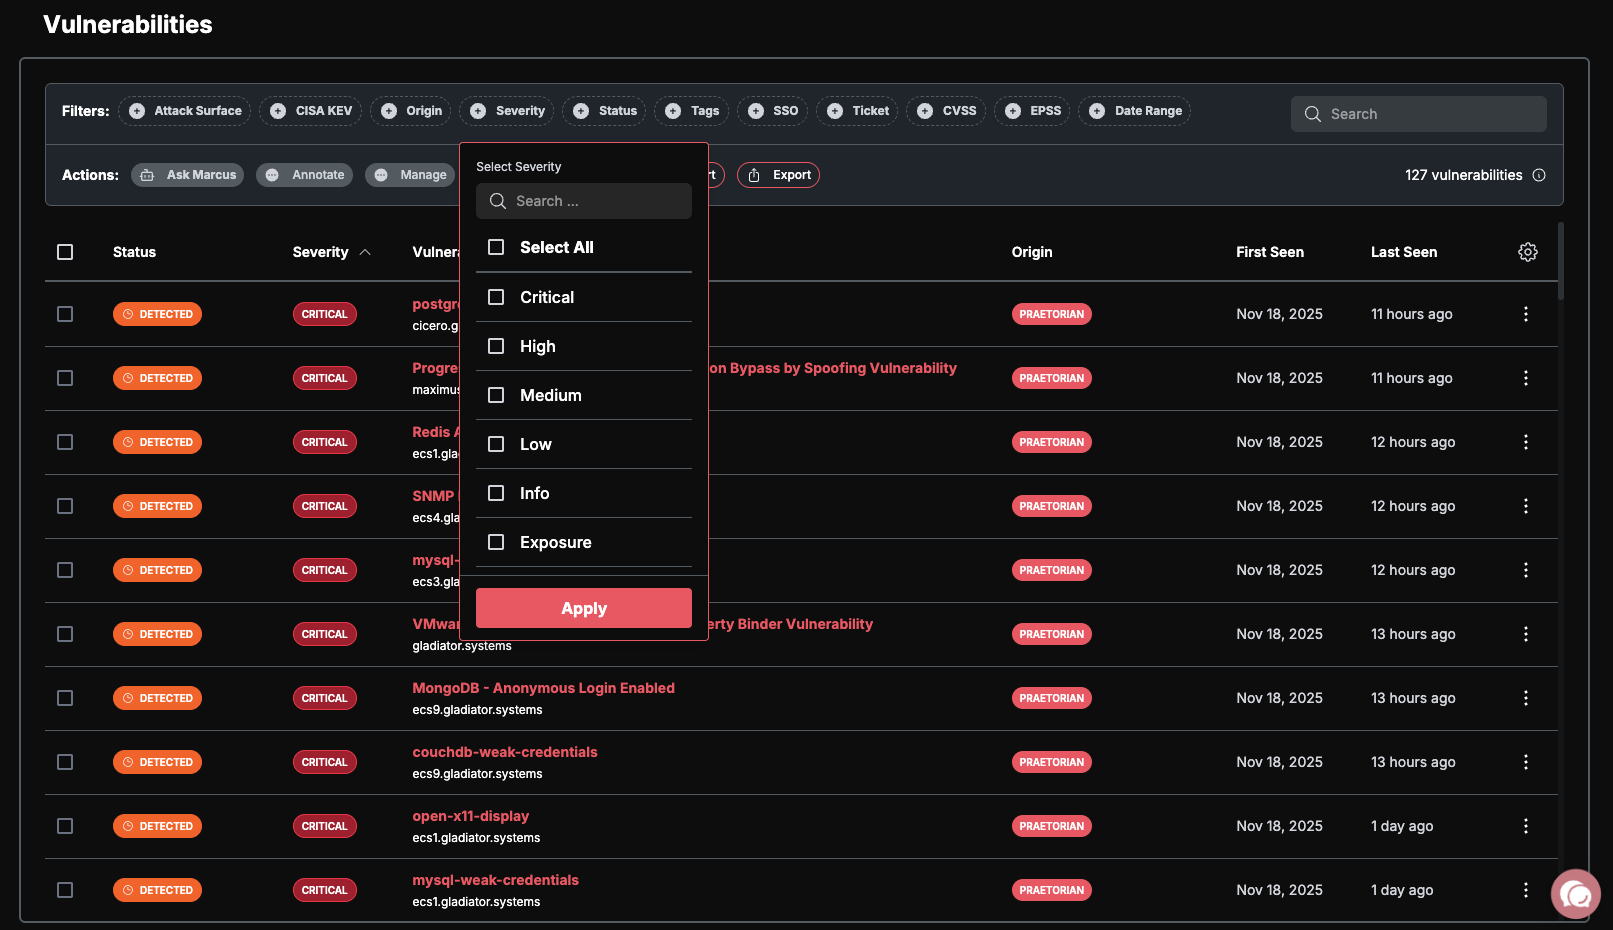
Each risk includes:
Severity — Rated as Critical, High, Medium, Low, Info, or Exposure.
Proof of exploitation — Evidence demonstrating the vulnerability is real, not theoretical.
Remediation guidance — Actionable steps to resolve the finding.
Risks follow a simple lifecycle:
Detected — Newly discovered, but not validated.
Demonstrated — Acknowledged and prioritized for your team.
Remediated — Fixed and verified by Guard.
Step 4: Connect Your Security Stack (Optional)
Navigate to Integrations in the sidebar.
Browse the available integrations and connect your existing tools:
Vulnerability scanners: Tenable, Qualys, Rapid7, Snyk
EDR/XDR: CrowdStrike, SentinelOne
Cloud security: Wiz, Orca, Prisma Cloud
Cloud accounts: AWS, Azure, GCP for automated asset discovery
Follow the on-screen prompts to authorize each integration.
Guard normalizes and deduplicates findings across all connected sources, giving you a single unified view of your security posture regardless of how many tools you use.
Core Workflows
Guard is built around four core workflows that take you from discovery to remediation:
1. Discovery Workflow
Seeds (your starting points) → Preseeds (review and approve discovered candidates) → Assets (confirmed inventory) → Scanning (automated assessment) → Risks (findings) → Remediation (resolution)
2. Scanning Workflow
Configure rate limits in Settings > Scan Settings, enable scanning capabilities, monitor jobs, and review findings as they come in. See Scan Limits for details.
3. AI Workflow
AI Inference (Query Mode) — Ask natural language questions about your data.
AI Automation (Background Agents) — Enable agents that continuously analyze your environment.
Agent Mode (Aurelius + Specialist Agents) — Full autonomous operation where Aurelius coordinates specialist agents to investigate, correlate, and recommend actions.
4. Integration Workflow
Connect external tools, let Guard normalize and deduplicate findings, and see results from every scanner in a single, consistent interface.
Quick Reference — "Where Do I Find...?"
What's Next
Now that you are up and running, explore these topics to get the most out of Guard:
Configure scan rate limits — Control how aggressively Guard scans your assets.
Set up team access (RBAC) — Invite team members and assign roles.
Enable AI features — Use natural language to query your attack surface.
Understand your dashboard — Deep dive into metrics, asset states, and risk severity.