Metrics
Insights → Metrics: track vulnerabilities, assets, and remediation trends across customizable dashboard widgets.
Insights → Metrics is a dashboard of security metrics. It is organized into three sections — Vulnerabilities, Assets, and Remediation — each made of customizable widgets.
Open Metrics
- Go to Insights → Metrics.
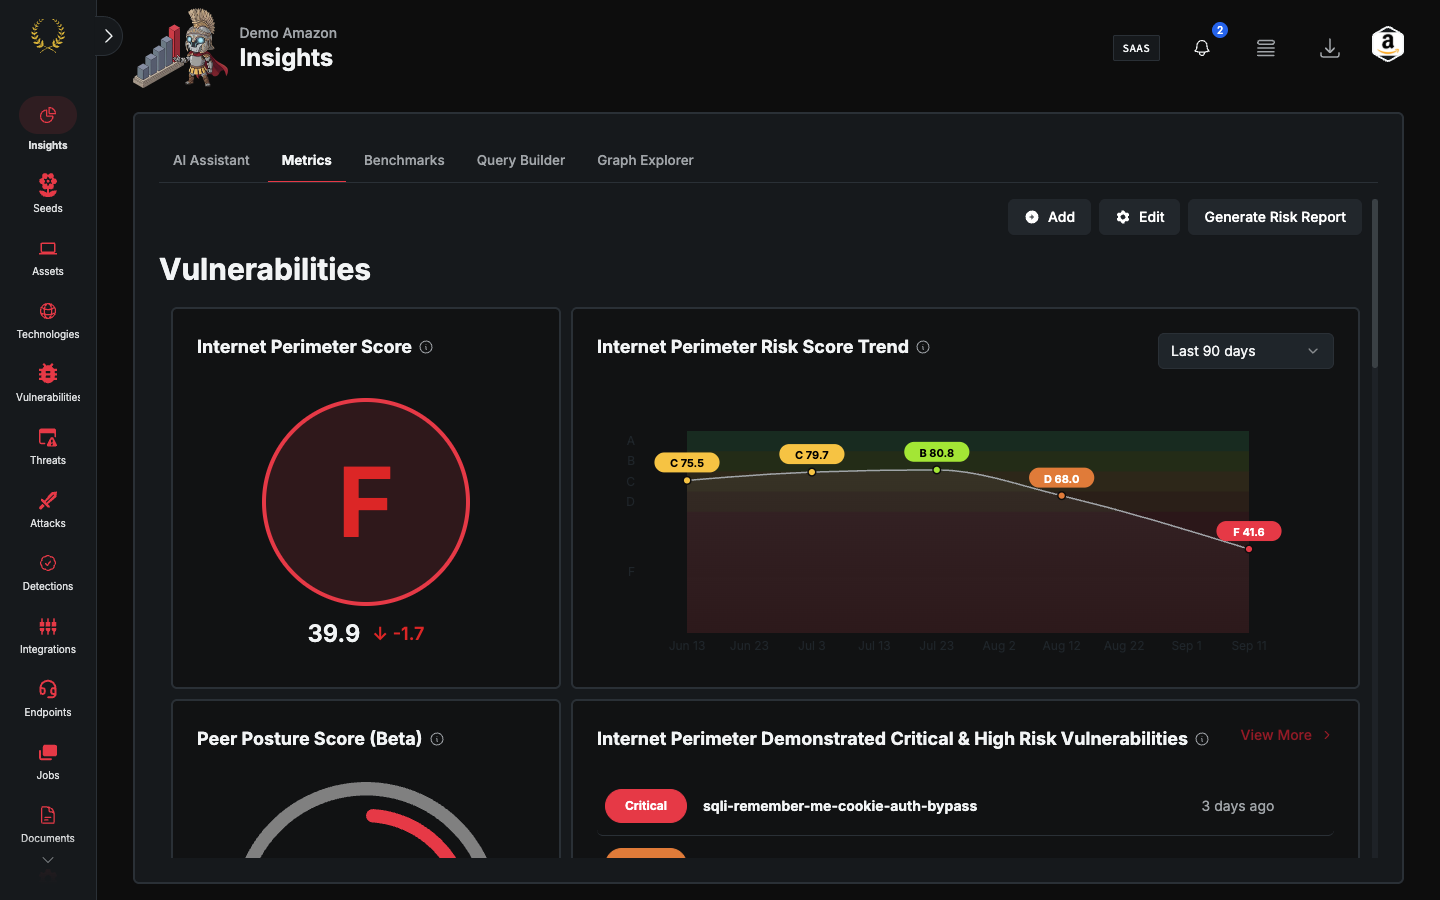
Review the charts and counts for assets, risks, and related trends. Use the date or filter controls on the tab to change the window. Perimeter score details are in How Your Internet Perimeter Score and Grade Are Calculated.
Default Layout
Vulnerabilities Section
The Noise Reduction widget displays open and remediated vulnerabilities side by side.
The Vulnerability Overview widget tracks how vulnerabilities are discovered and resolved over time.
The Internet Perimeter Demonstrated Critical & High Risk Vulnerabilities widget lists demonstrated Critical and High vulnerabilities on internet-facing assets.
The Vulnerability Analysis widget shows a timeline of vulnerabilities broken down by severity.
Assets Section
The External Attack Surface widget maps your assets by geographic region.
The External Perimeter Asset Counts widget breaks down your inventory by type, and the Assets Over Time widget shows how your asset count has changed.
Remediation Section
The Remediated Vulnerabilities Over Time widget shows remediated vulnerabilities over time, broken down by severity.
The Average Remediation Time widget displays the mean time taken to address vulnerabilities of different severity levels.
The Median Remediation Time widget displays the median time taken to address vulnerabilities, which is less affected by outliers than the average.
Dashboard Customization
You can customize the dashboard:
- Add — Click Add to incorporate additional widgets into any section.
- Edit — Click Edit to enter edit mode, where you can drag and drop widgets to resize and reposition them.
- Save or Cancel — Click Save to keep the layout, or Cancel to discard changes.
- Reset — Within edit mode, click Reset to restore the dashboard to its original configuration.
Your layout is saved automatically and persists across sessions.
Support
If a chart is empty, reach out to support@praetorian.com.
Was this helpful?
Still need help? Ask the team