Validations
Validations
Validations in Guard
The Validations page is the central hub for Breach & Attack Simulation (BAS) results in Guard. It brings together offensive testing outcomes, defensive control assessments, and embedded device threat modeling into a single view organized across five tabs: Overview, MITRE ATT&CK, MITRE D3FEND, MITRE EMB3D, and Gap Analysis.
Each tab maps to a distinct layer of your security posture. Together they answer three questions: What attacks have we tested? What defenses do we have in place? Where are the gaps?
Overview Tab
The Overview tab is an executive-level dashboard that surfaces the most important metrics and action items from across all validation data.
Security Posture Score
The centerpiece of the Overview tab is the Security Posture Score, a single 0-100 metric displayed as a circular progress indicator. The score is color-coded by rating and computed from three weighted components:
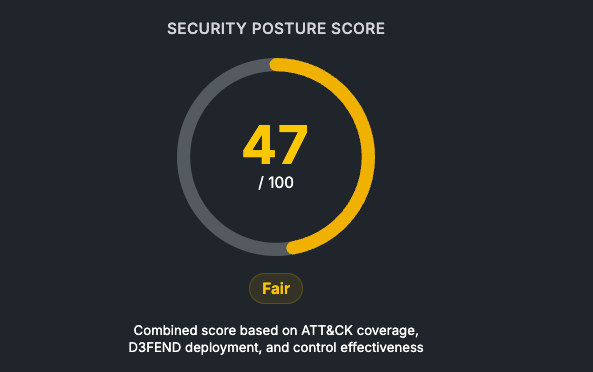
Formula: (Attack Coverage x 0.4) + (Defense Coverage x 0.35) + (Effective Defense x 0.25)
The resulting score maps to a five-tier rating:
If no validation data has been collected yet, the score displays as Not Assessed with a prompt to run a validation.
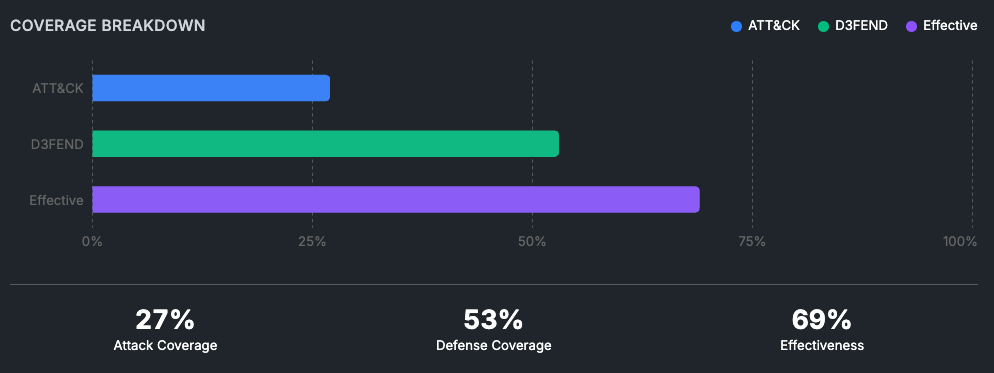
Coverage Breakdown
Beside the score widget, a horizontal bar chart provides a side-by-side comparison of the three component metrics — ATT&CK Coverage, D3FEND Deployment, and Defense Effectiveness — each shown as a percentage bar with summary statistics underneath.
Top Security Gaps
A table lists the highest-priority security gaps ranked by criticality, showing:
Technique - The ATT&CK technique ID and name
Tactic - The ATT&CK tactic category the technique belongs to
Missing Defenses - The count of D3FEND controls that are not effectively deployed for this technique
Risk Score - A 0-100 score factoring in prevalence weight, defense status, and test outcome
Priority - Critical, High, Medium, or Low
Clicking any row navigates directly to that technique in the Gap Analysis tab. A footer summarizes gap counts by tactic.
Recommended Actions
The Recommendations widget analyzes all current gaps and identifies which D3FEND techniques would provide the greatest coverage improvement if deployed. Recommendations are ranked by impact — the number of undefended ATT&CK techniques each D3FEND control would help cover. Each recommendation links to the official D3FEND documentation for the suggested technique.
MITRE ATT&CK Tab
The ATT&CK tab shows your offensive posture — which attack techniques have been simulated and what the defensive outcome was for each.
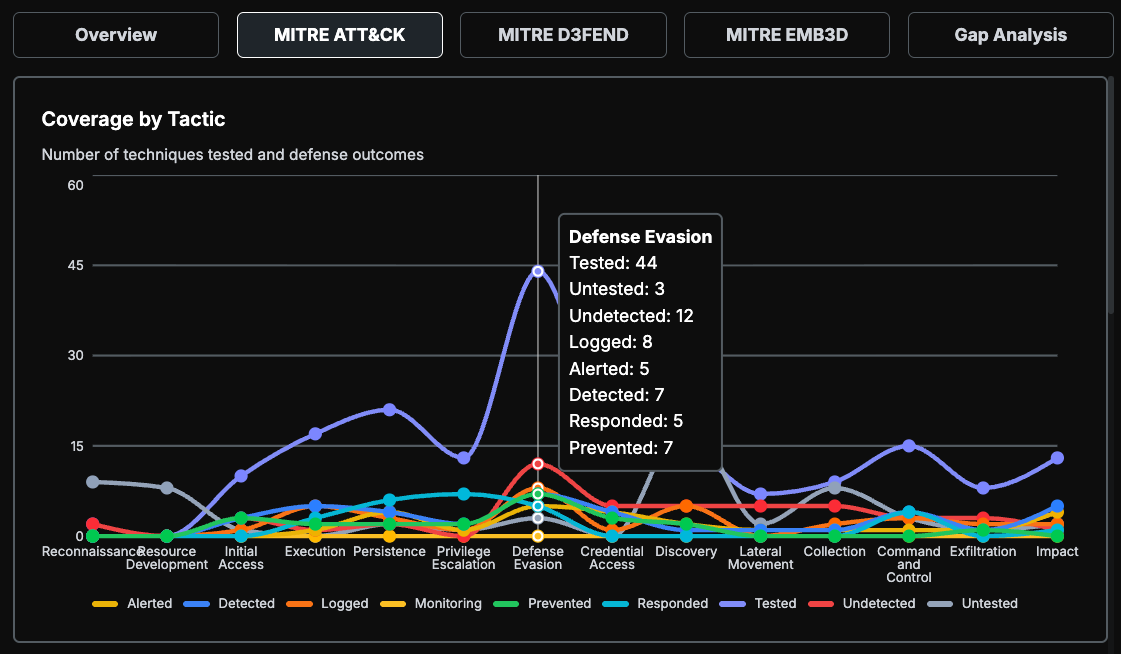
Coverage Graph
A bar chart at the top of the tab visualizes testing coverage across ATT&CK tactics (Reconnaissance, Initial Access, Execution, Persistence, etc.). Each bar shows how many techniques within that tactic have been tested and their resulting defense outcomes.
Technique Heatmap Table
Below the graph, a detailed heatmap table organizes every ATT&CK technique by tactic. Each cell represents a technique or sub-technique and is color-coded by its defense outcome:
Techniques that have not yet been tested appear in an untested/neutral state. Guard aligns to MITRE ATT&CK v14.1 with coverage spanning 198 techniques and 400+ sub-techniques.
MITRE D3FEND Tab
The D3FEND tab shows your defensive posture — what security controls are in place, how broadly they are deployed, and how effective they are when put to the test.
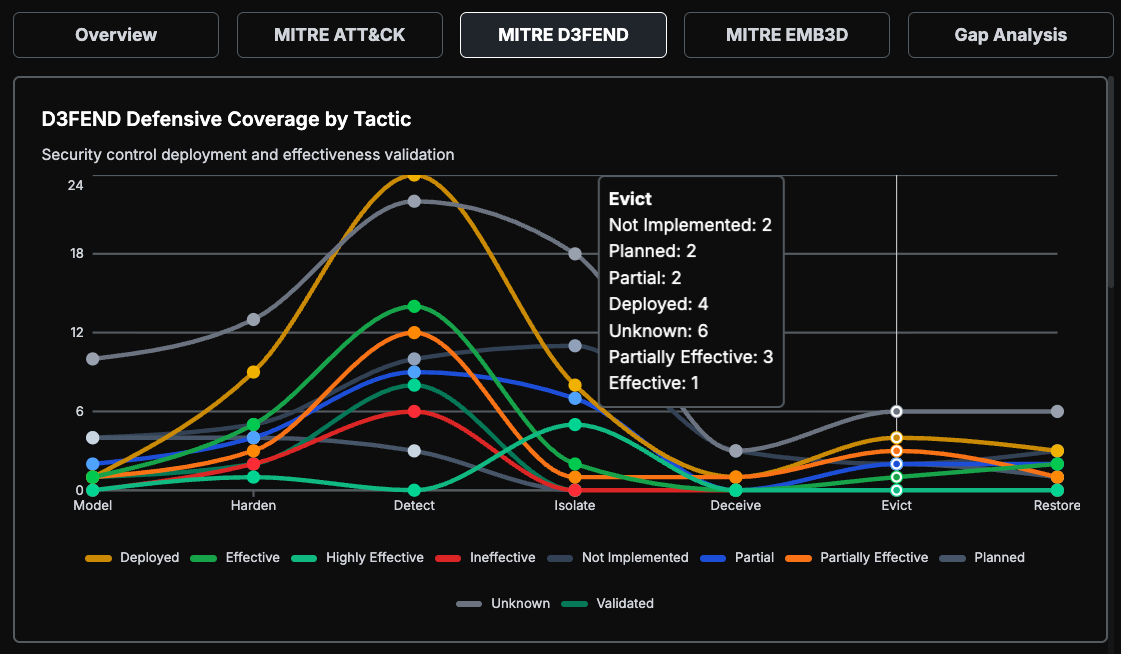
Defensive Coverage Graph
A chart breaks down coverage across the seven D3FEND defensive tactics:
Presence Status Heatmap
The table displays each of the 92 mapped D3FEND techniques with a two-dimensional assessment:
Dimension 1 — Presence (Do we have this control?):
Dimension 2 — Effectiveness (Does it work?):
Applicable only to controls with Deployed or Validated presence:
Effectiveness data can come from multiple testing methods: Purple Team exercises, BAS simulations, Red Team engagements, security audits, or penetration tests.
Guard maps 334 relationships between ATT&CK techniques and D3FEND controls, so each defensive technique shows which attack techniques it mitigates and which digital artifacts (Process, File, Network Traffic, etc.) it operates on.
MITRE EMB3D Tab
The EMB3D tab addresses embedded device security for organizations with ICS/SCADA, IoT, or medical device environments. It uses the MITRE EMB3D threat model to assess threats specific to embedded hardware and firmware.
Embedded Device Score
Similar to the Security Posture Score, the EMB3D tab features its own 0-100 score with the same five-tier rating scale (Critical through Excellent).
Formula: (Weighted Mitigated Threats / Applicable Threats) x 100
Mitigation weights:
By excluding untested and not-applicable threats from the denominator, the score reflects only what has actually been evaluated, avoiding penalization for irrelevant threat categories.
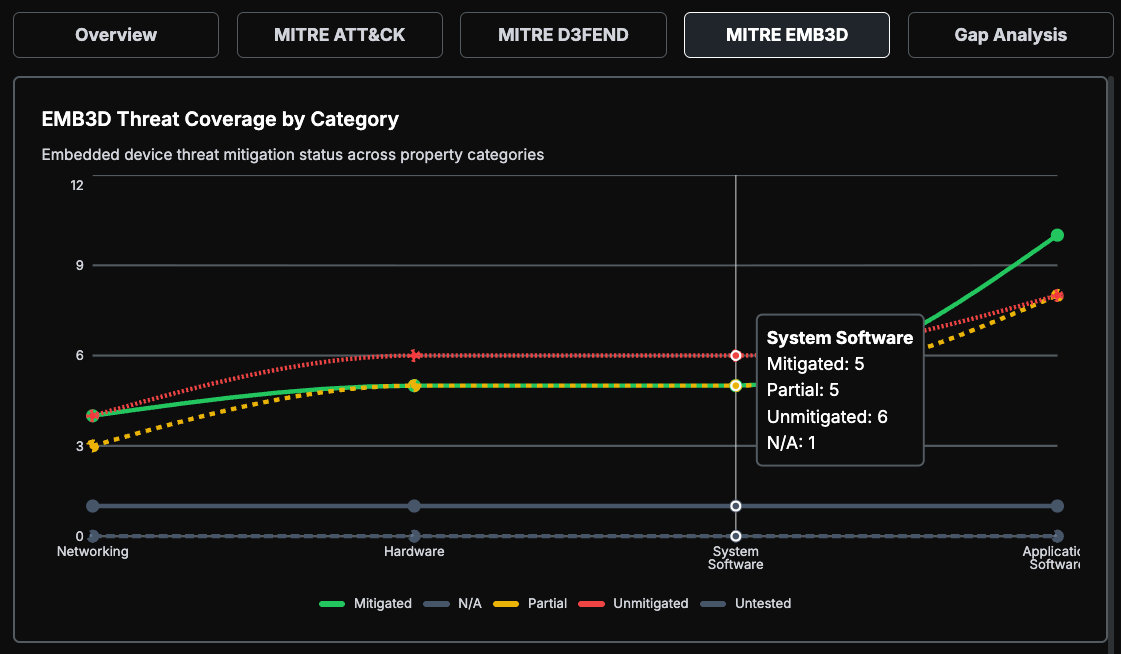
Coverage Distribution and Category Breakdown
A donut chart shows the distribution of threats across mitigation statuses. Below it, per-category breakdown bars show mitigation progress across the four EMB3D threat categories:
Threat Heatmap Table
A detailed table lists every EMB3D threat organized by category. Each threat shows its mitigation status, the device types it applies to (ICS, IoT, Medical, or All), and any linked mitigation controls.
Gap Analysis Tab
The Gap Analysis tab identifies the specific points where your ATT&CK technique coverage and D3FEND defensive controls do not align. It cross-references the two frameworks using 334 technique-to-control mappings and surfaces the techniques that lack effective defense.
Filters and Export
Filters at the top let you narrow results by:
Tactic — Filter by ATT&CK tactic (e.g., Initial Access, Lateral Movement)
Priority — Filter by remediation priority (Critical, High, Medium, Low)
Testing Status — Filter by whether a technique has been tested or not
All filter state is synchronized with the URL, so filtered views can be bookmarked or shared. The tab supports exporting the current filtered view to CSV or JSON format.
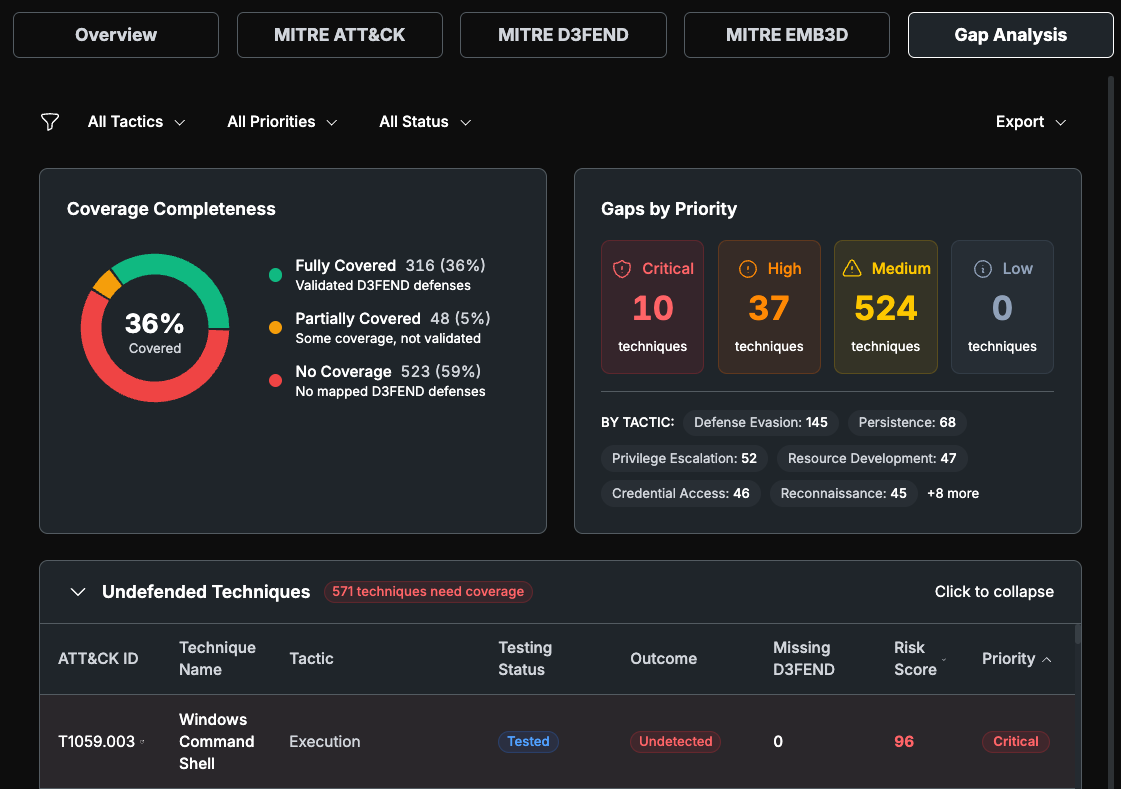
Coverage Completeness
A donut chart visualizes how techniques break down across three coverage levels:
Fully Covered — At least one mapped D3FEND control is deployed and rated Effective or Highly Effective
Partially Covered — A D3FEND control is deployed but is not rated as effective
No Coverage — No mapped D3FEND control is deployed
Gap Summary Statistics
A statistics panel breaks down gaps by remediation priority and by ATT&CK tactic, giving a quick view of where the largest concentrations of gaps exist.
Priority is calculated from prevalence weight and defense status:
Undefended Techniques Table
The main table lists every ATT&CK technique that lacks effective defensive coverage. Columns include:
ATT&CK ID and Name
Tactic
Tested / Outcome — Whether the technique was tested and what happened
Missing Defense Count — Number of recommended D3FEND controls not effectively deployed
Risk Score — 0-100 composite of prevalence weight, defense status, and test outcome
Priority — Remediation priority level
Clicking a row opens a Detail Drawer that shows the full context for that technique: which D3FEND controls are recommended, their current presence and effectiveness status, and specific remediation guidance.
Ineffective Controls Table
A collapsible section below the main table lists D3FEND controls that are deployed but not performing effectively. Each entry shows:
The D3FEND technique name and current effectiveness rating
How many ATT&CK techniques it is supposed to protect against
A recommended action: Tune (for Partially Effective controls) or Replace (for Ineffective controls)
This table helps teams prioritize where to invest tuning effort for the greatest return in coverage improvement.
How Data Feeds Into Validations
Validation data comes from two primary sources:
BAS Monitoring Sessions — Guard executes attack simulations and polls connected EDR/SIEM/NDR platforms (Microsoft Defender, CrowdStrike, SentinelOne, ExtraHop, Panther) for matching alerts. Detection matching uses rule-based filters (hostname, file hash, MITRE technique ID) with LLM-assisted classification as a fallback for ambiguous alerts.
MITRE Framework Reference Data — Guard maintains curated datasets aligned to MITRE ATT&CK v14.1, D3FEND, and EMB3D, along with technique-to-control mappings and prevalence weights derived from the Picus Red Report. These datasets provide the structural backbone that validation results are scored and visualized against.
All scores, gap analyses, and recommendations are computed from the combination of these two sources — real test outcomes mapped against the full MITRE framework landscape.