Attacks
Attacks
Attack Page Documentation
The Attack page provides a comprehensive view of potential attack paths that could affect your organization. It documents how Praetorian security engineers proved compromise during assessments, helping you understand, visualize, and assess various attack vectors and the effectiveness of your defenses.
Overview
The Attack page centers on Attack Paths — interactive visualizations of real-world attack scenarios executed against your environment. Each attack path can be explored through two views:
Graph View: An interactive node-and-edge diagram showing how attackers moved through your systems
Narrative View: A report-style document describing the attack lifecycle with stages, technical details, and indicators of compromise
Graph View
The Graph View displays an interactive diagram showing how attackers moved through your systems. The graph is composed of four types of nodes connected by edges.
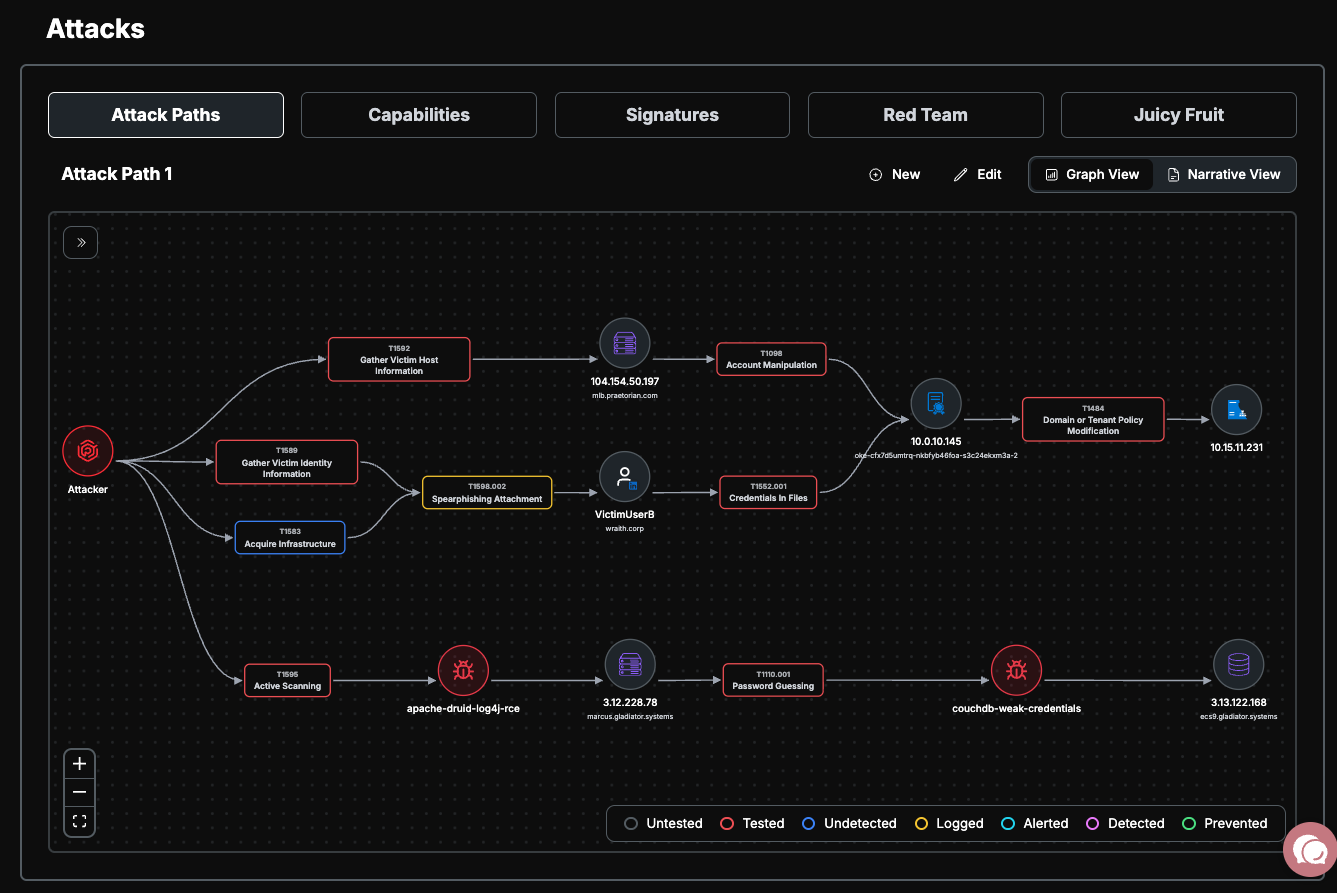
Node Types
Attacker Nodes: Circular nodes representing the threat actor's entry points. Variants include the primary entry point, infrastructure (C2 servers, domains), and payloads.
Asset Nodes: Circular nodes representing target systems in the attack path. These display icons for specific asset types such as cloud providers (AWS, Azure, GCP), servers, databases, containers, CI/CD platforms, and Active Directory/Kerberos.
Technique Nodes: Rounded rectangle nodes representing MITRE ATT&CK® techniques used during the attack. Each technique node is color-coded by its defense status and displays its technique ID and name. Hovering over a technique node shows a popover with additional details, and you can click through to the official MITRE ATT&CK documentation.
Vulnerability Nodes: Nodes representing specific security vulnerabilities or risks exploited in the attack path, color-coded by severity (Critical, High, Medium, Low, Info).
Technique Defense Statuses
Each technique node is color-coded to indicate how your defenses responded:
A color legend is displayed in the bottom-right corner of the graph for quick reference.

Stages
Attack paths are organized into stages — sequential phases of the attack lifecycle. Stages appear in a collapsible pill bar on the left side of the graph.
Click a stage to highlight the associated nodes on the graph; unrelated nodes are dimmed
Click the same stage again to clear the highlight
When a stage is selected, a Stage Detail Panel appears below the graph showing:
Stage name and result status
A summary of the stage
A table of techniques and on-host actions, including the target host, technique ID, and defense status
Navigating the Graph
If multiple attack paths exist, select one from the dropdown at the top of the view by clicking on the attack path name
Use the mouse to pan (scroll) and zoom around the diagram
Hover over technique nodes to see additional details in a popover
Click through to official MITRE ATT&CK documentation from technique nodes
Use the controls in the bottom-left to:
Zoom in/out
Fit the view to screen
Use the Stage Pill Bar on the left to navigate between attack stages
Narrative View
The Narrative View presents the attack path as a structured report document. Toggle between Graph View and Narrative View using the view switcher in the top-right corner of the page.
Structure
The narrative is organized into the following sections:
Engagement Header: The same target, timeframe, and summary displayed in the Graph View
Attack Narrative: A series of expandable Stage Cards, one for each phase of the attack. Each stage card includes:
Stage name and result status badge
A summary and detailed technical description
Techniques used during the stage
On-host actions — an ordered list of post-exploitation steps executed on specific target hosts, including:
Action description and status
Associated MITRE ATT&CK technique
Artifacts and indicators of compromise (IoCs) such as URLs, file hashes, file paths, registry keys, and commands
Indicators of Compromise (IoC) Table: An aggregated table at the bottom collecting all artifacts and indicators from across all stages for blue team log validation
Navigating the Narrative
Click on a stage card to expand or collapse it (only one stage is expanded at a time)
Review on-host actions within each stage to understand the step-by-step attack sequence
Use the IoC table at the bottom to cross-reference indicators across your logging and detection systems
Managing Attack Paths
Attack paths are created and maintained by the Praetorian team to document how Praetorian security engineers proved compromise during assessments. These paths demonstrate real-world attack scenarios and techniques that were successfully executed against your environment.
Notes
The MITRE ATT&CK® coverage view (heatmap and technique table) is available under the Validations section of the platform, not in the Attacks page
Some features within the Attacks page may require specific entitlements to access
All changes to attack paths are logged for audit purposes