Knossos User Guide
Complete guide to configuring, generating, deploying, and monitoring Knossos deception environments
This guide walks through the full Knossos workflow: configuring cloud integrations, generating a deception environment, deploying it, and monitoring attacker activity.
Prerequisites
Cloud Integrations
Knossos builds deception environments that mirror your real cloud infrastructure. To generate realistic decoys, it needs visibility into your existing resources — naming conventions, tagging patterns, topology, and resource distributions.
Configure at least one cloud integration before using Knossos:
Navigate to Settings > Integrations and follow the setup wizard for your cloud provider. Knossos reads from the platform's existing resource inventory — it does not make direct API calls to your cloud accounts. The richer your integration data, the more convincing the generated decoys.
For AWS, the platform ingests resources through its cloud security integrations. Knossos uses this data to reverse-engineer your organization's cloud fingerprint: how you name things, how you tag them, which instance types you favor, and how your network topology is laid out.
Feature Activation
Knossos is feature-flagged. If you see a "Deception Environments Locked" message when navigating to the Knossos section, contact support@praetorian.com to enable it for your account.
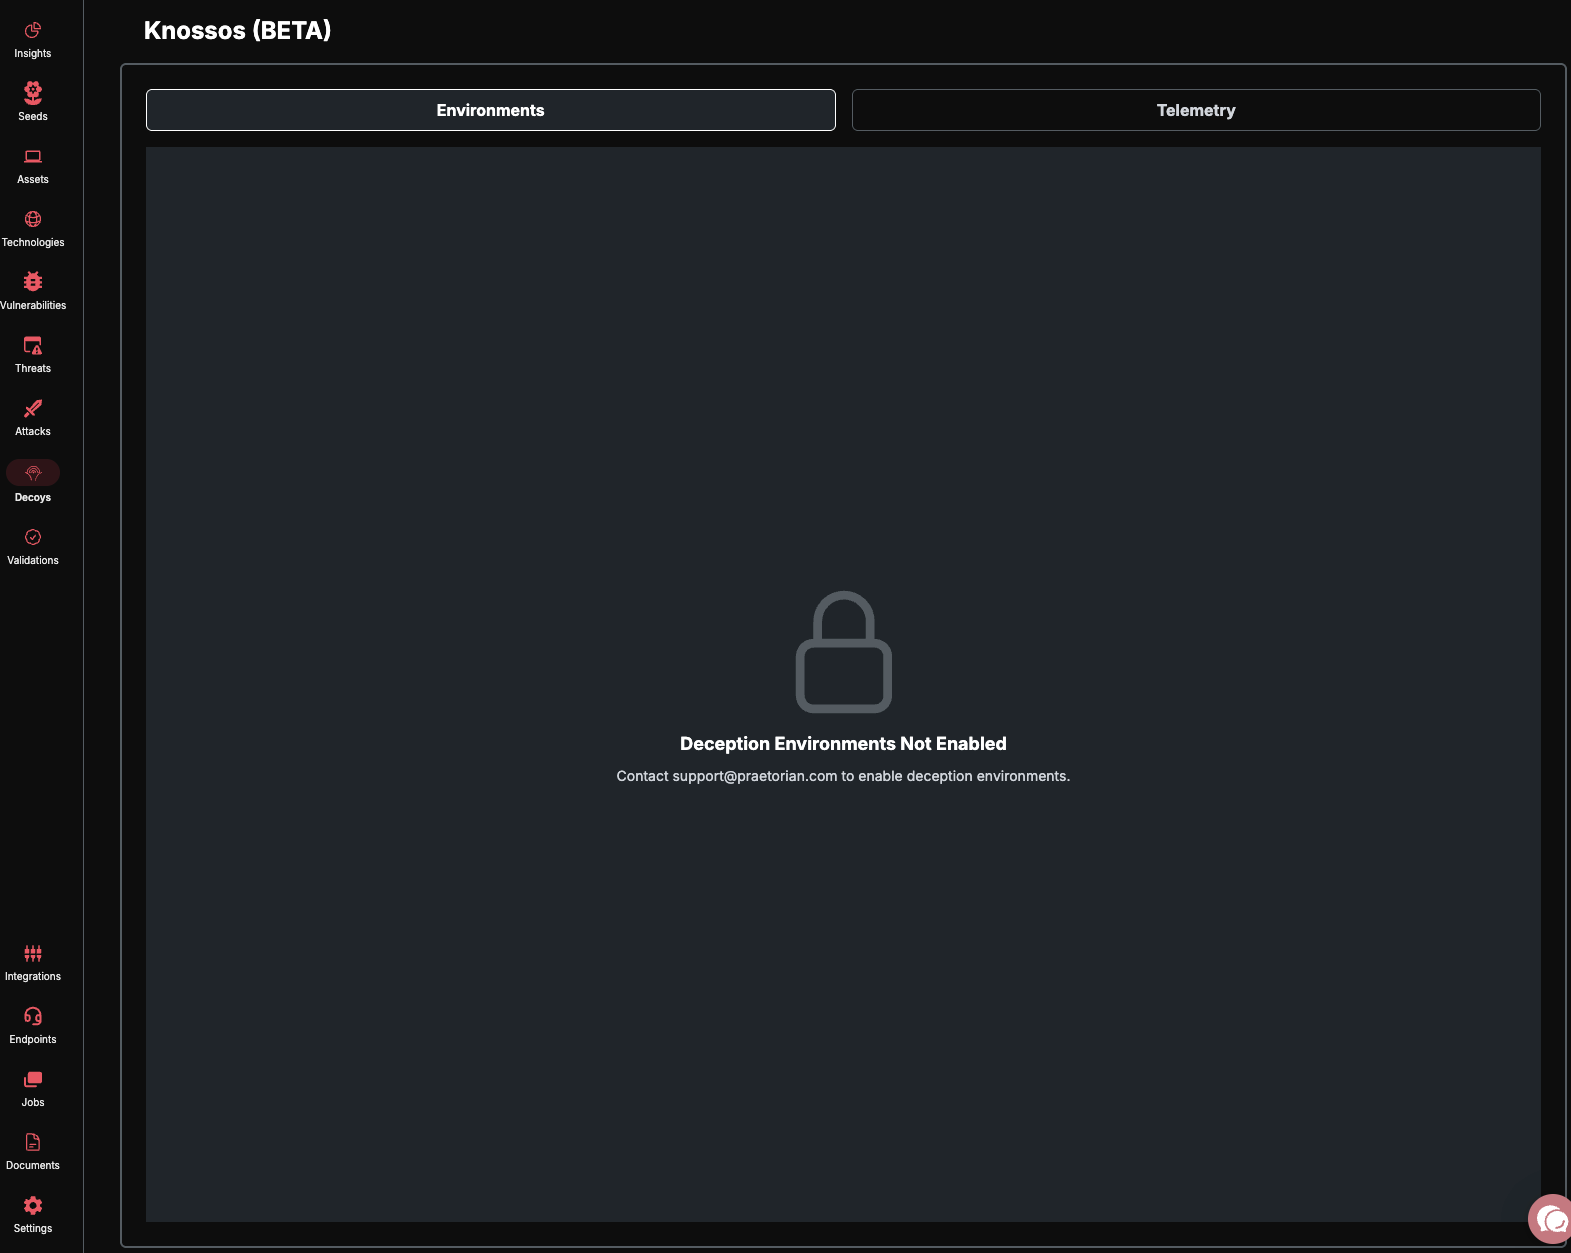
Once enabled, Knossos appears in the main navigation under its own section.
Navigating Knossos
Knossos is organized into two tabs:
Environments — Create, configure, and manage deception environments
Telemetry — Monitor attacker activity in deployed environments
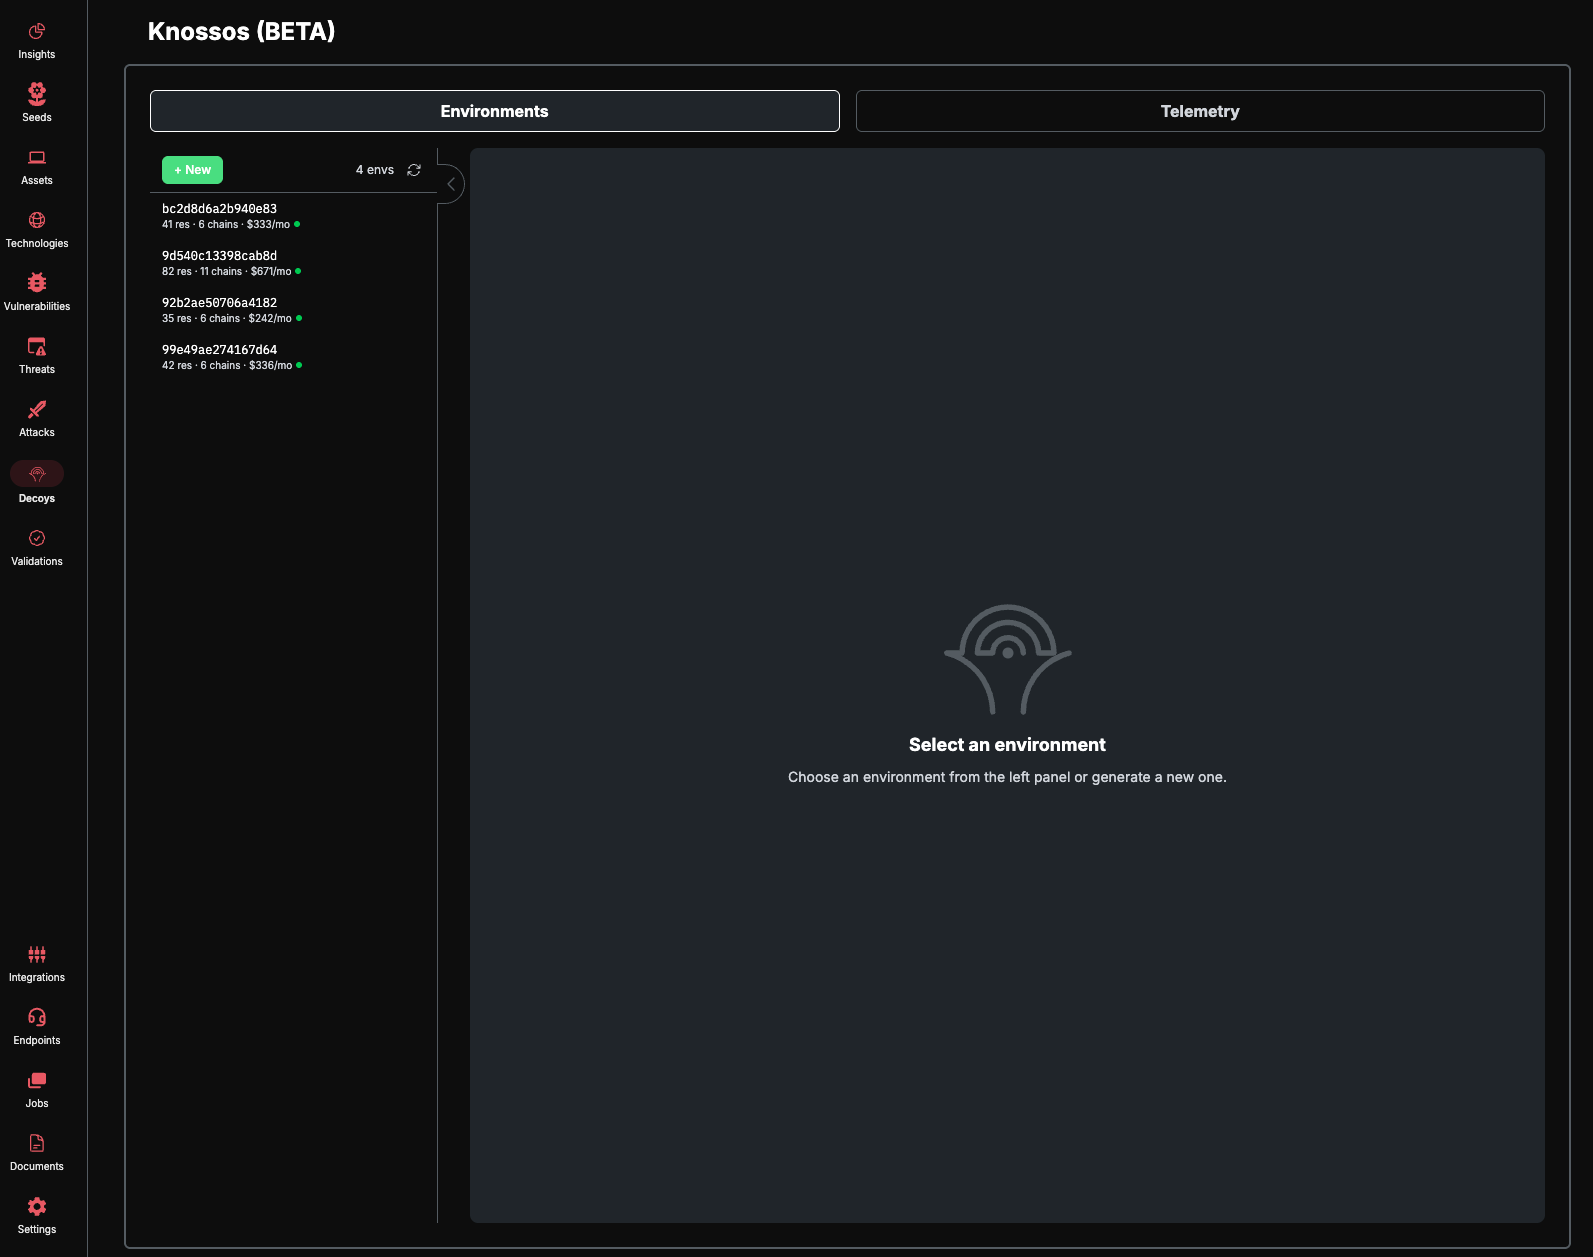
Creating an Environment
Click + New in the Environments panel header to open the Generator. The generator has three configuration sections accessible from the left sidebar menu:
General — Core generation settings
Miner Config — Pattern detection tuning
Resource Caps — Cost and resource limits
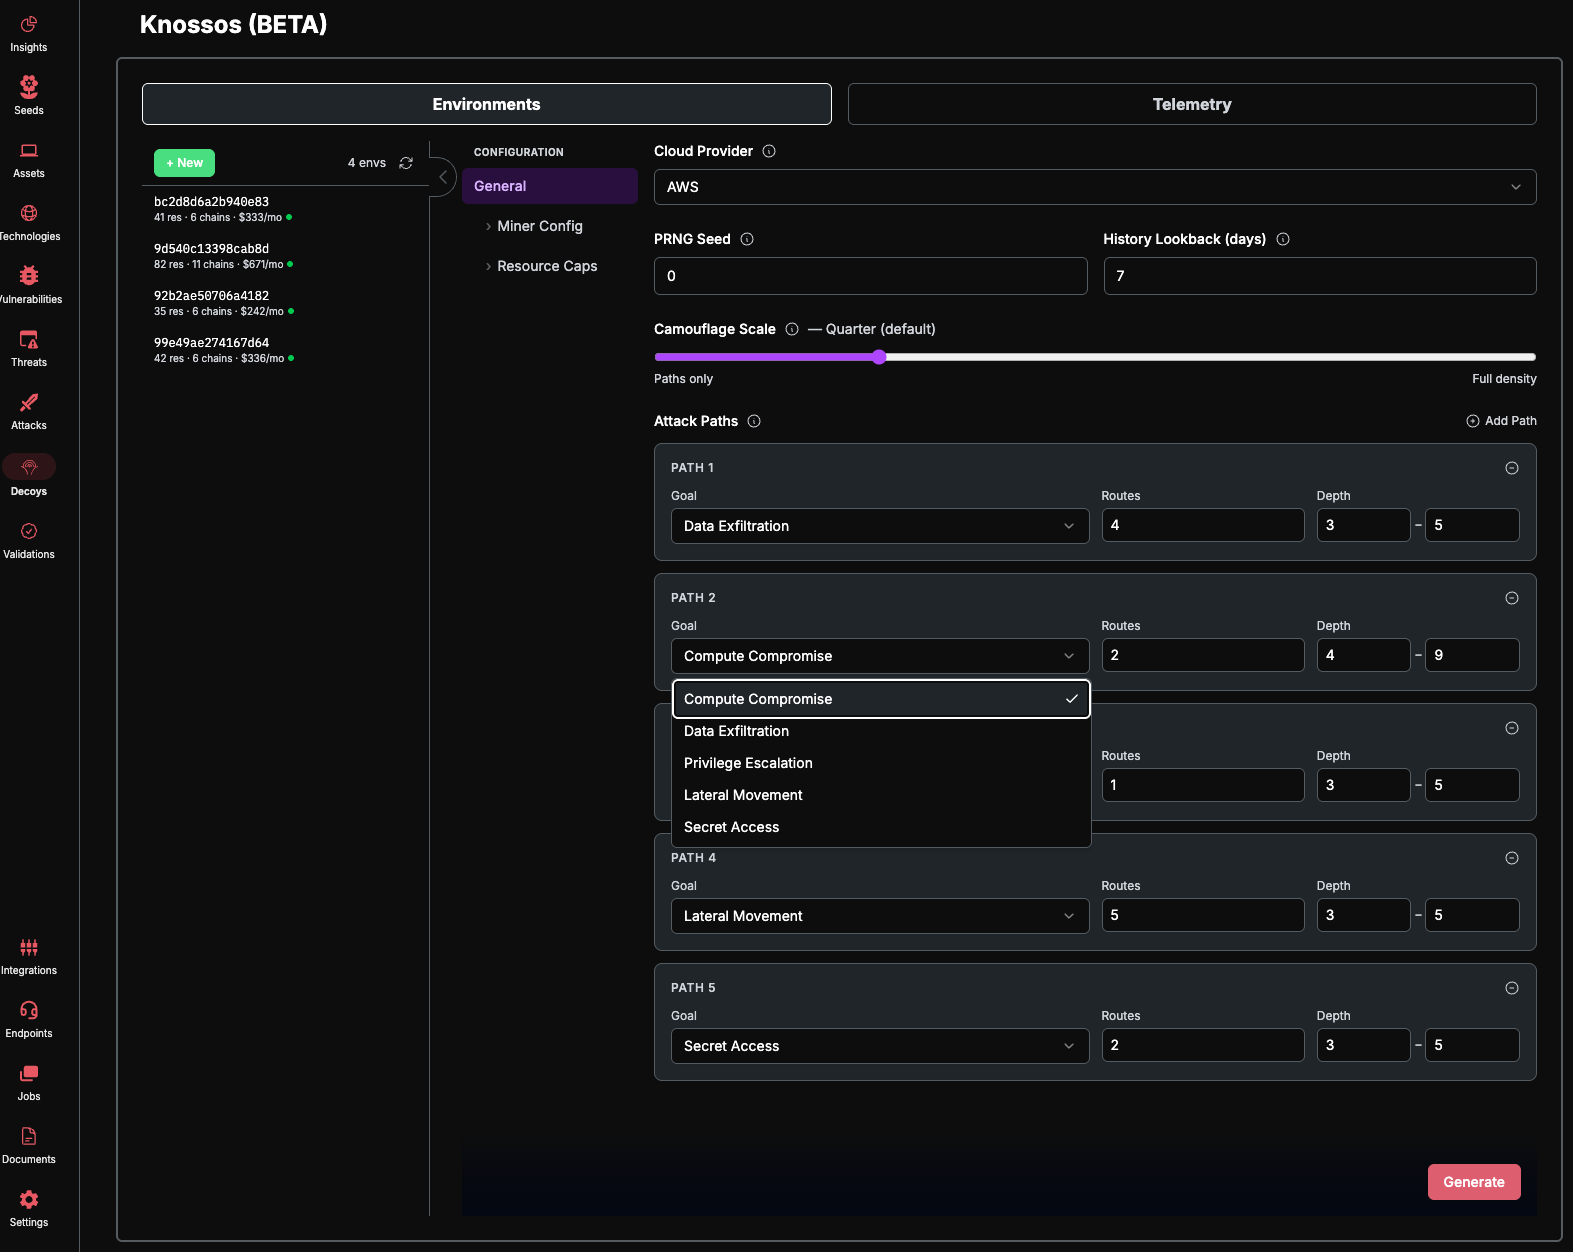
General Settings
Cloud Provider
Select the cloud platform whose naming conventions and topology will be used for the deception environment.
Default: AWS
PRNG Seed
Controls reproducibility. The same seed combined with the same profile produces an identical environment every time.
Default:
0(random)Set a specific seed to regenerate the same environment deterministically
History Lookback (days)
Number of days of synthetic CloudTrail history to generate. Longer lookback periods make the environment appear more established and credible to an attacker reviewing activity logs.
Default:
7Range: 0–365 days
Camouflage Scale
Controls how many padding resources surround the attack path resources. Higher values produce denser environments that more closely match your real infrastructure's resource density.
Default: 0.25
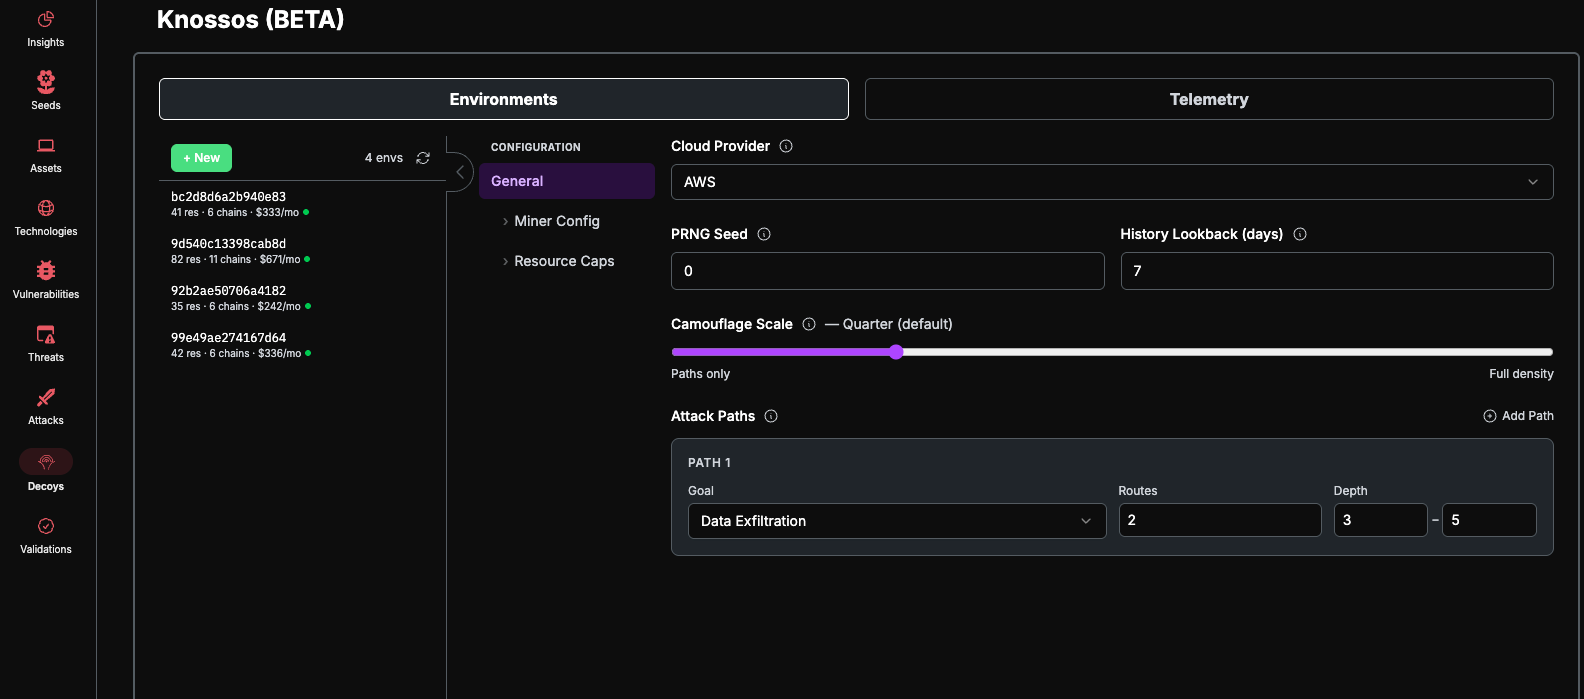
Attack Paths
Attack paths define the deception scenarios embedded in your environment. Each path represents a chain of breadcrumb-connected resources that lead an attacker through a series of discoveries toward a specific goal.
Click + Add Path to add additional attack paths. Each path is configured independently.
Goal
The objective of the attack chain — determines the types of resources and breadcrumbs used.
Default: Data Exfiltration
Routes
Number of independent attack routes to generate for this goal. Multiple routes create parallel paths to the same objective, making the environment more realistic.
Default:
2Range: 1–10
Depth (Min–Max)
The number of steps in each attack route. Each step represents one resource-to-resource hop the attacker must make.
Min Depth Default:
3Max Depth Default:
5Range: 1–15
A chain with depth 3–5 means each route will have between 3 and 5 resource hops. Deeper chains waste more attacker time but require more resources.
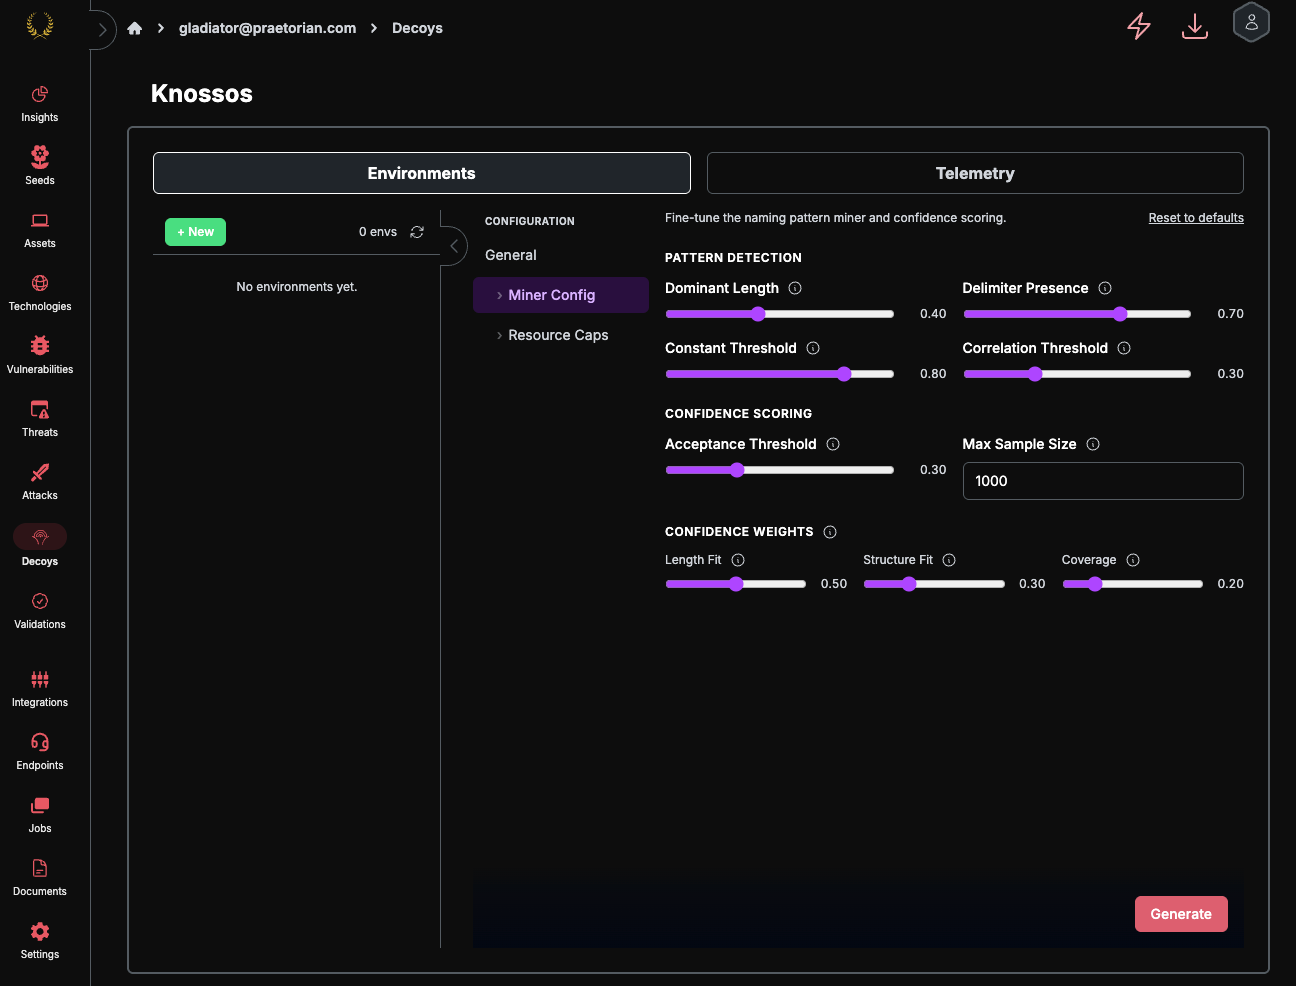
Miner Config
The miner analyzes your real infrastructure's naming patterns to generate convincing resource names. These settings control how aggressively the miner detects and applies patterns.
Click Reset to defaults to restore all miner settings to their default values.
Pattern Detection
Dominant Length — If 40% or more of names for a resource type share the same token count (e.g., 3 tokens separated by hyphens), the miner treats that length as the pattern.
Delimiter Presence — If 70% or more of names contain a specific delimiter (e.g.,
-or_), it is used in generated names.Constant Threshold — If 80% or more of names have the same value in a token position (e.g., all start with
prod), that position is treated as a constant.Correlation Threshold — Detects correlations between token positions (e.g.,
us-eastalways pairs withprod). Higher values require stronger correlations.
Confidence Scoring
Acceptance Threshold — Patterns scoring below this confidence level are discarded. Lower values accept weaker patterns; higher values require strong statistical evidence.
Max Sample Size — Caps the number of real resource names sampled per type. Larger samples improve pattern accuracy but increase inference time.
Confidence Weights
The confidence score is computed as: W1 x LengthFit + W2 x StructureFit + W3 x Coverage
Adjust these weights to prioritize different aspects of pattern quality. The defaults emphasize consistent naming length (W1=0.5) with secondary weight on structural regularity (W2=0.3) and coverage (W3=0.2).
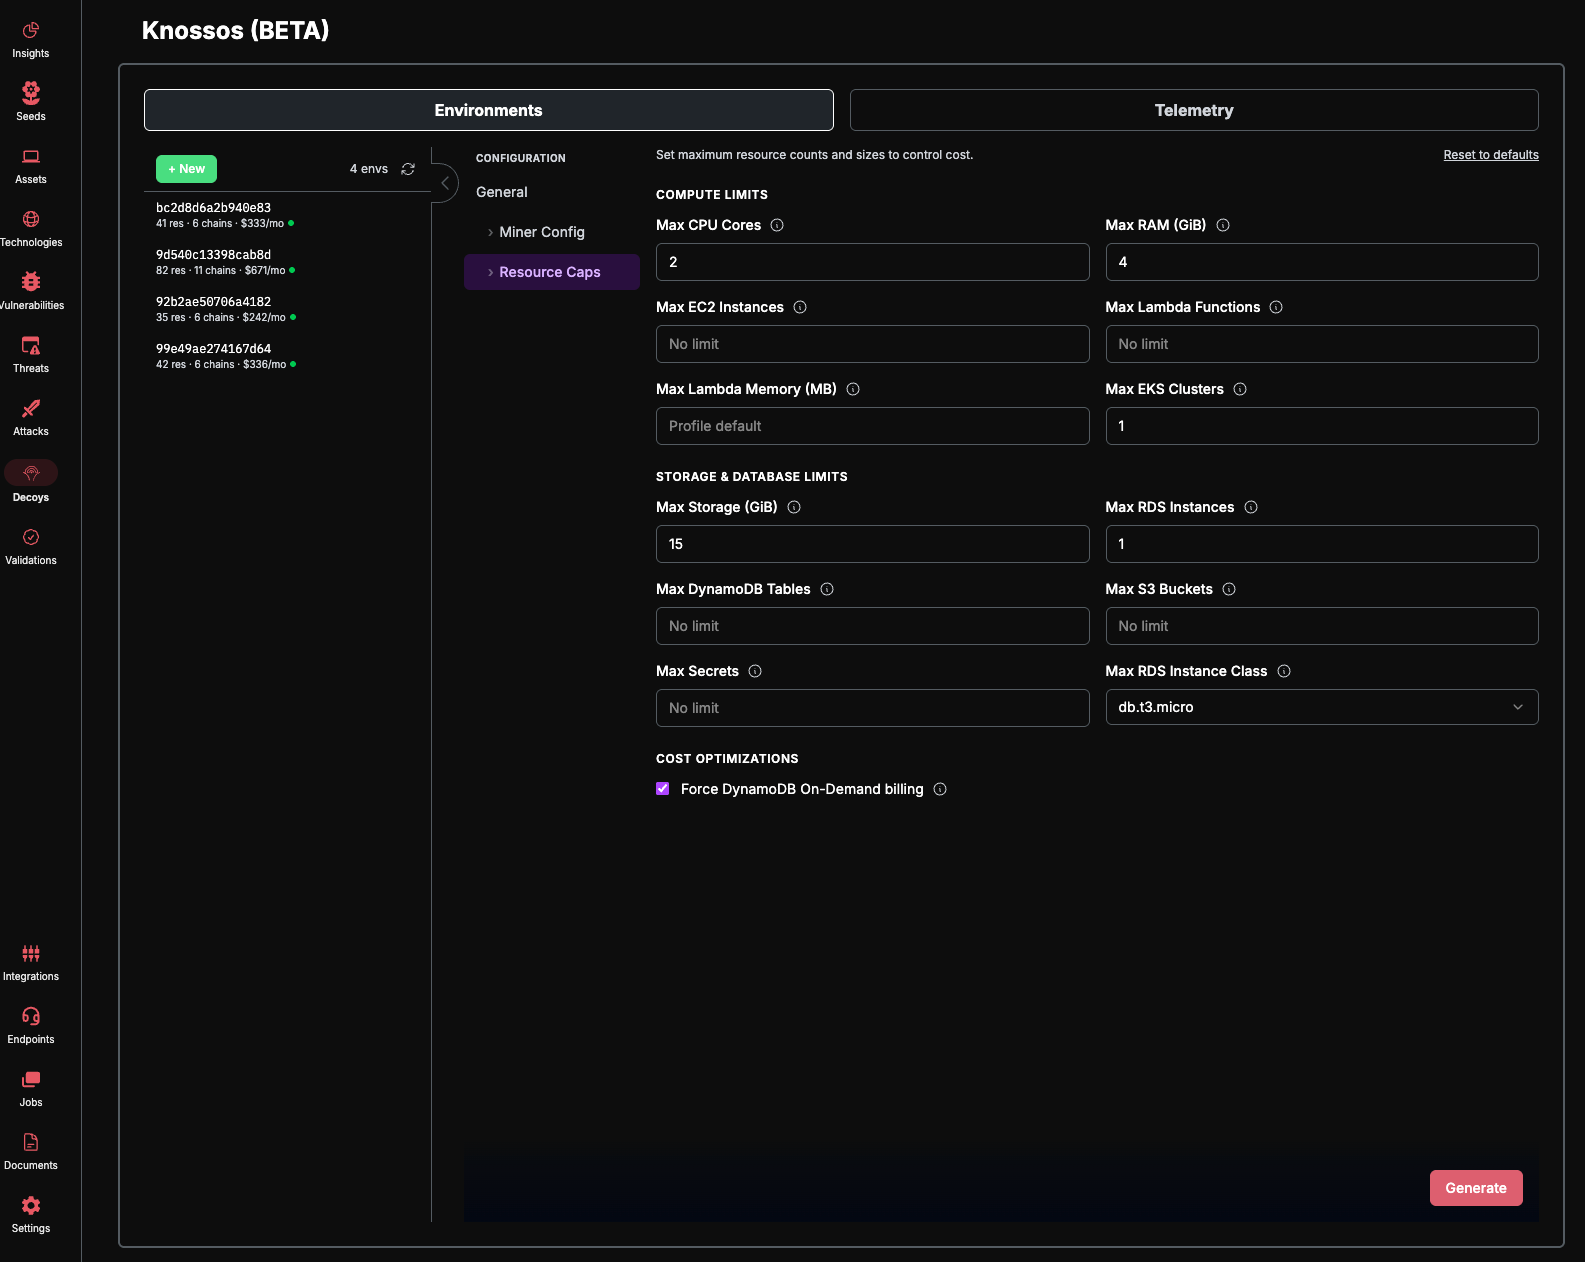
Resource Caps
Resource caps set upper bounds on resource counts and sizes to control the cost of your deception environment. Click Reset to defaults to restore all caps to their default values.
Compute Limits
Storage & Database Limits
Available RDS instance classes: db.t3.micro, db.t3.small, db.t3.medium, db.t3.large, db.r6g.large, db.r6g.xlarge
Cost Optimizations
When enabled, all DynamoDB tables use on-demand billing mode, which incurs zero cost when no reads or writes occur — ideal for decoy tables that are rarely touched.
Generating the Environment
After configuring all settings, click the Generate button at the bottom-right of the generator panel. Generation runs three stages:
Profile Inference — Analyzes your real infrastructure data to build a style profile
Environment Generation — Creates the decoy environment manifest using the style profile and your configuration
HCL Emission — Translates the manifest into deployable Terraform
The generated environment appears in the left sidebar list when complete.
Viewing an Environment
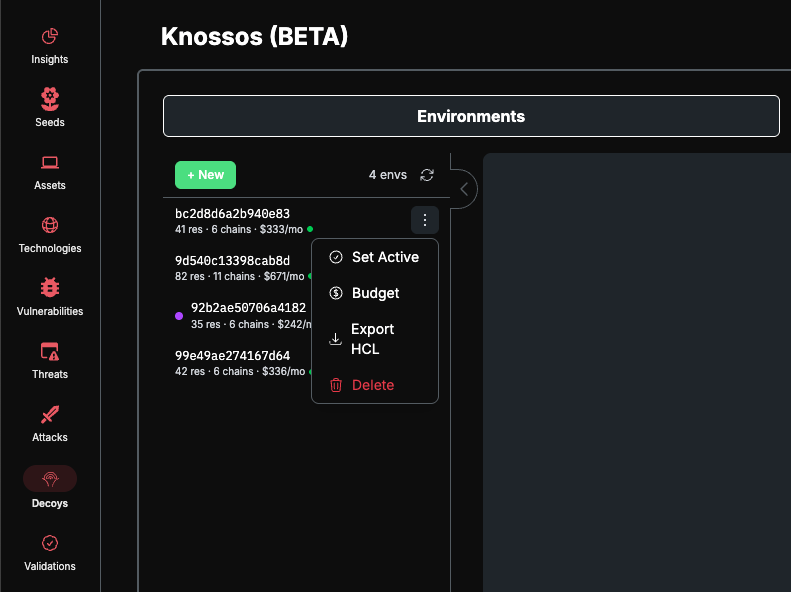
Click any environment in the left sidebar to view its details. Each environment item shows:
Environment ID (truncated)
Total resource count
Attack chain count
Estimated monthly cost
Pricing indicator — Green dot for live AWS pricing, yellow for estimated rates
The detail panel has two tabs:
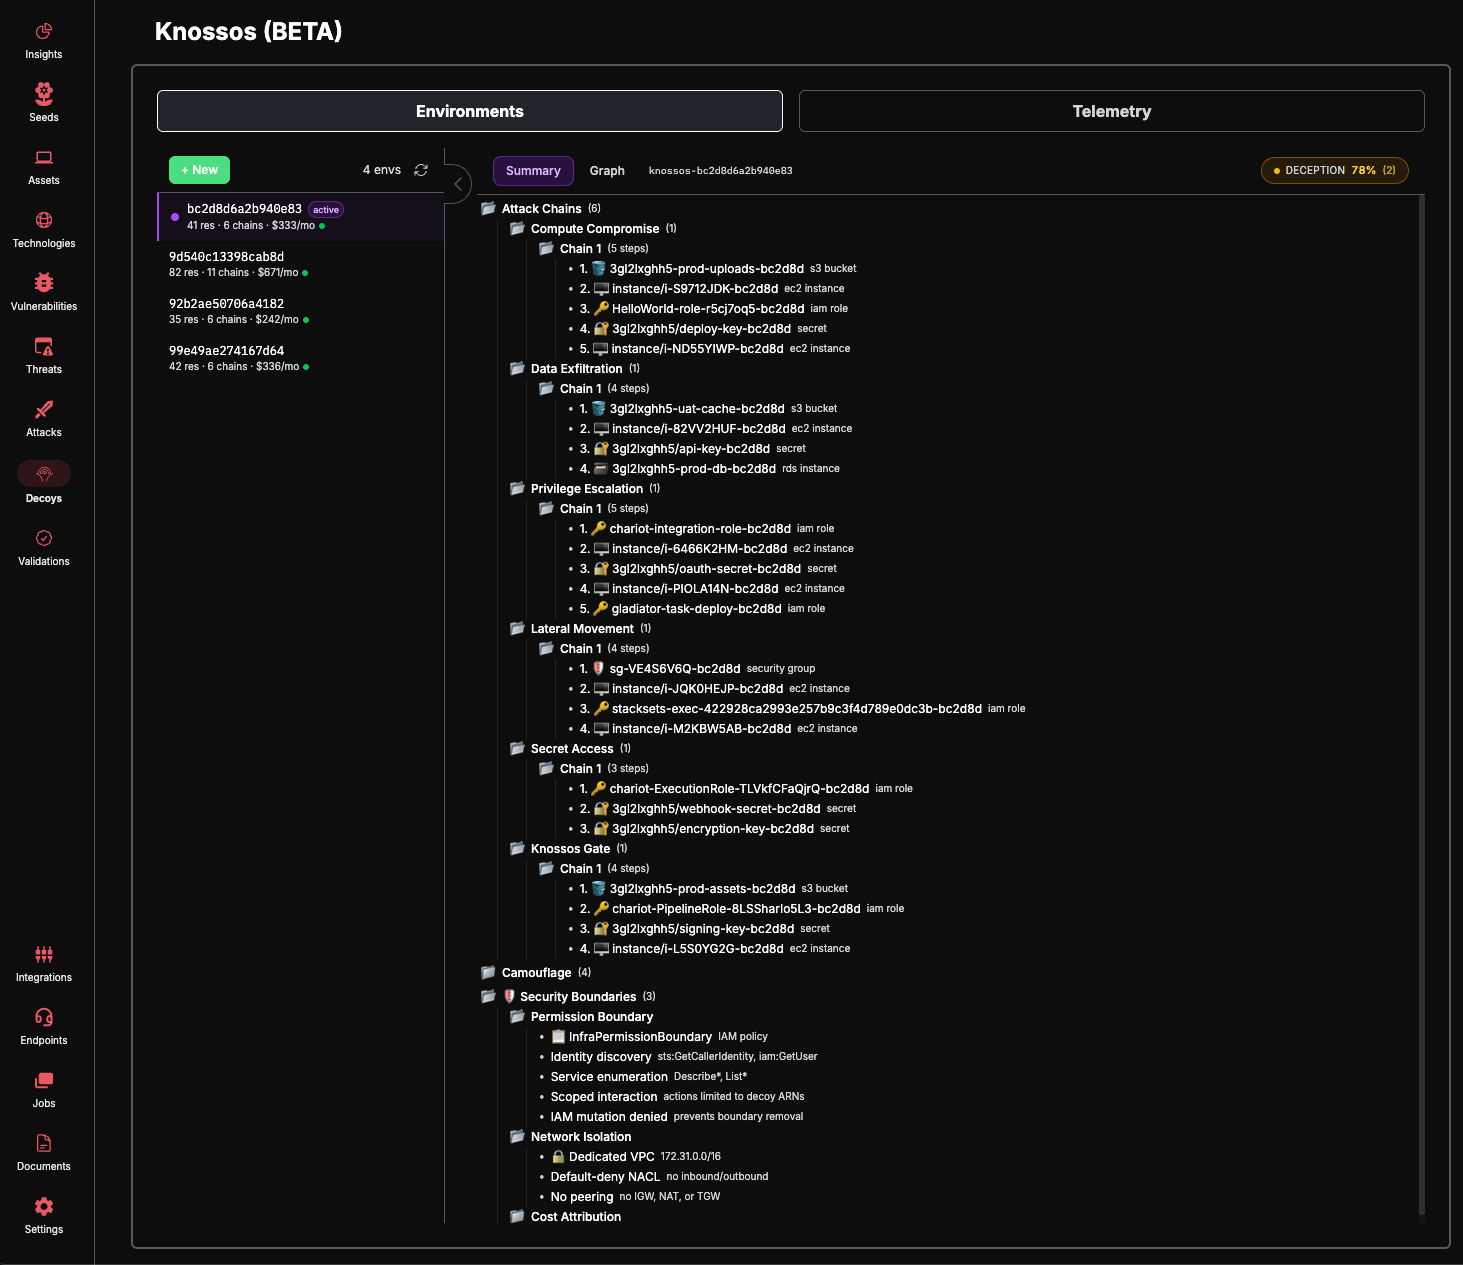
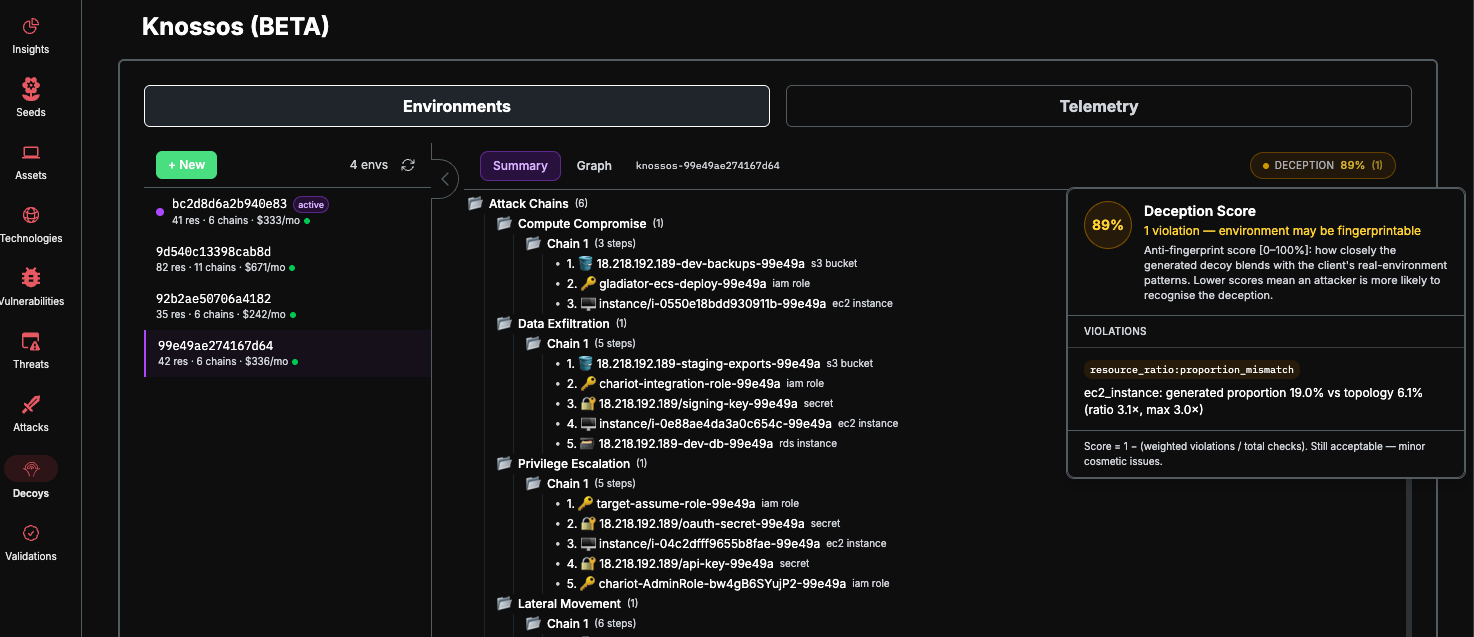
Summary Tab
A tree view showing the environment's resource breakdown, attack chain structure, and validation score.
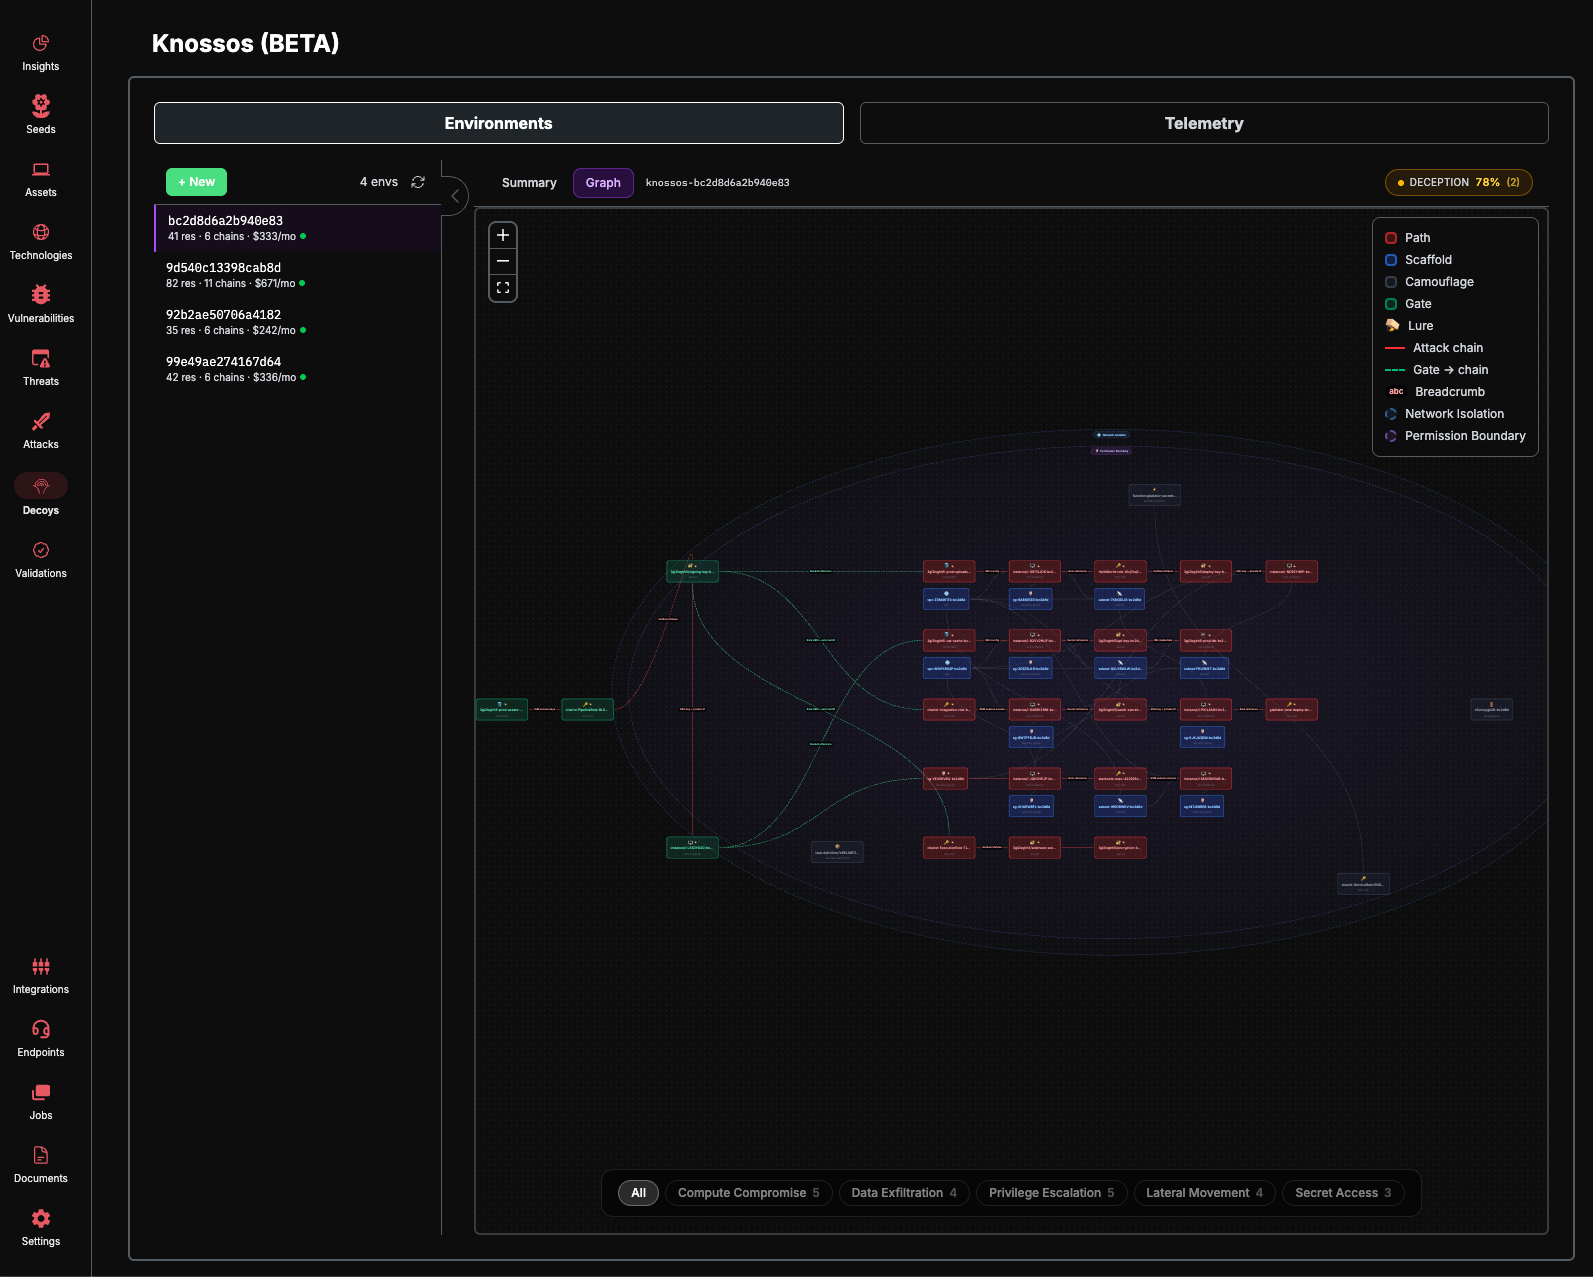
Graph Tab
An interactive graph visualization of the entire deception environment. See Interpreting the Graph View for details.
Deception Score
A badge in the top-right corner of the environment detail shows the Deception Score — a percentage measuring the environment's resistance to automated fingerprinting. The score is color-coded:
Red — Low anti-fingerprint score; the environment may be detectable
Amber — Moderate score; some fingerprinting vectors remain
Green — High score; the environment closely mimics real infrastructure
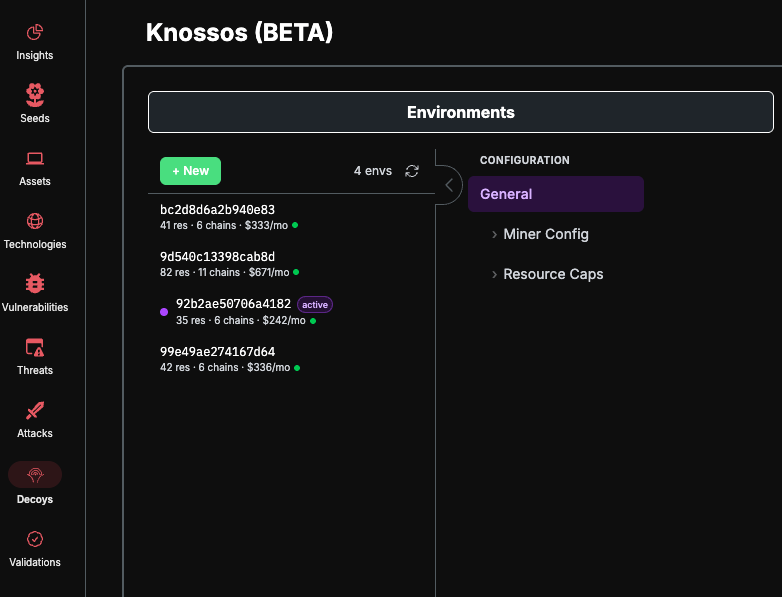
Setting an Active Environment
From the environment list, open the row action menu and click Set Active. The active environment is indicated by a purple dot and an "active" badge.
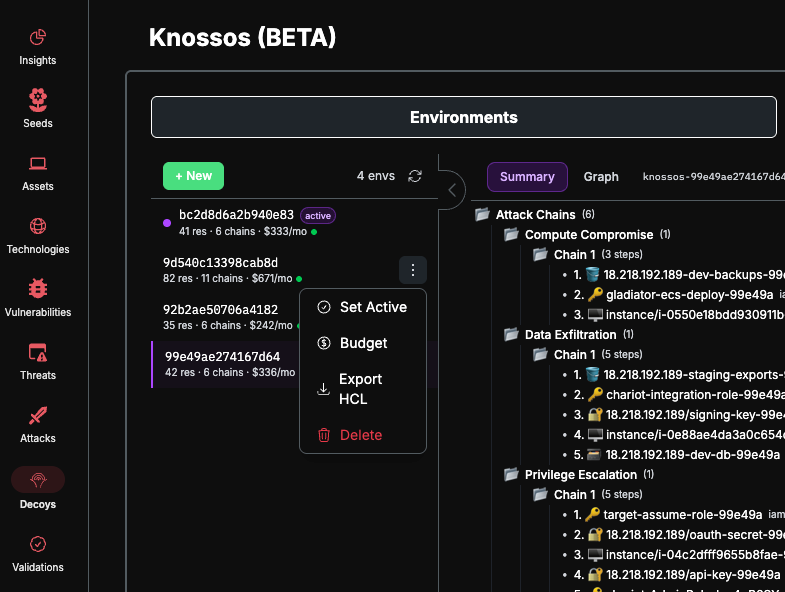
The active environment is the one monitored by the Telemetry tab. Only one environment can be active at a time. Click Deactivate to remove the active designation.
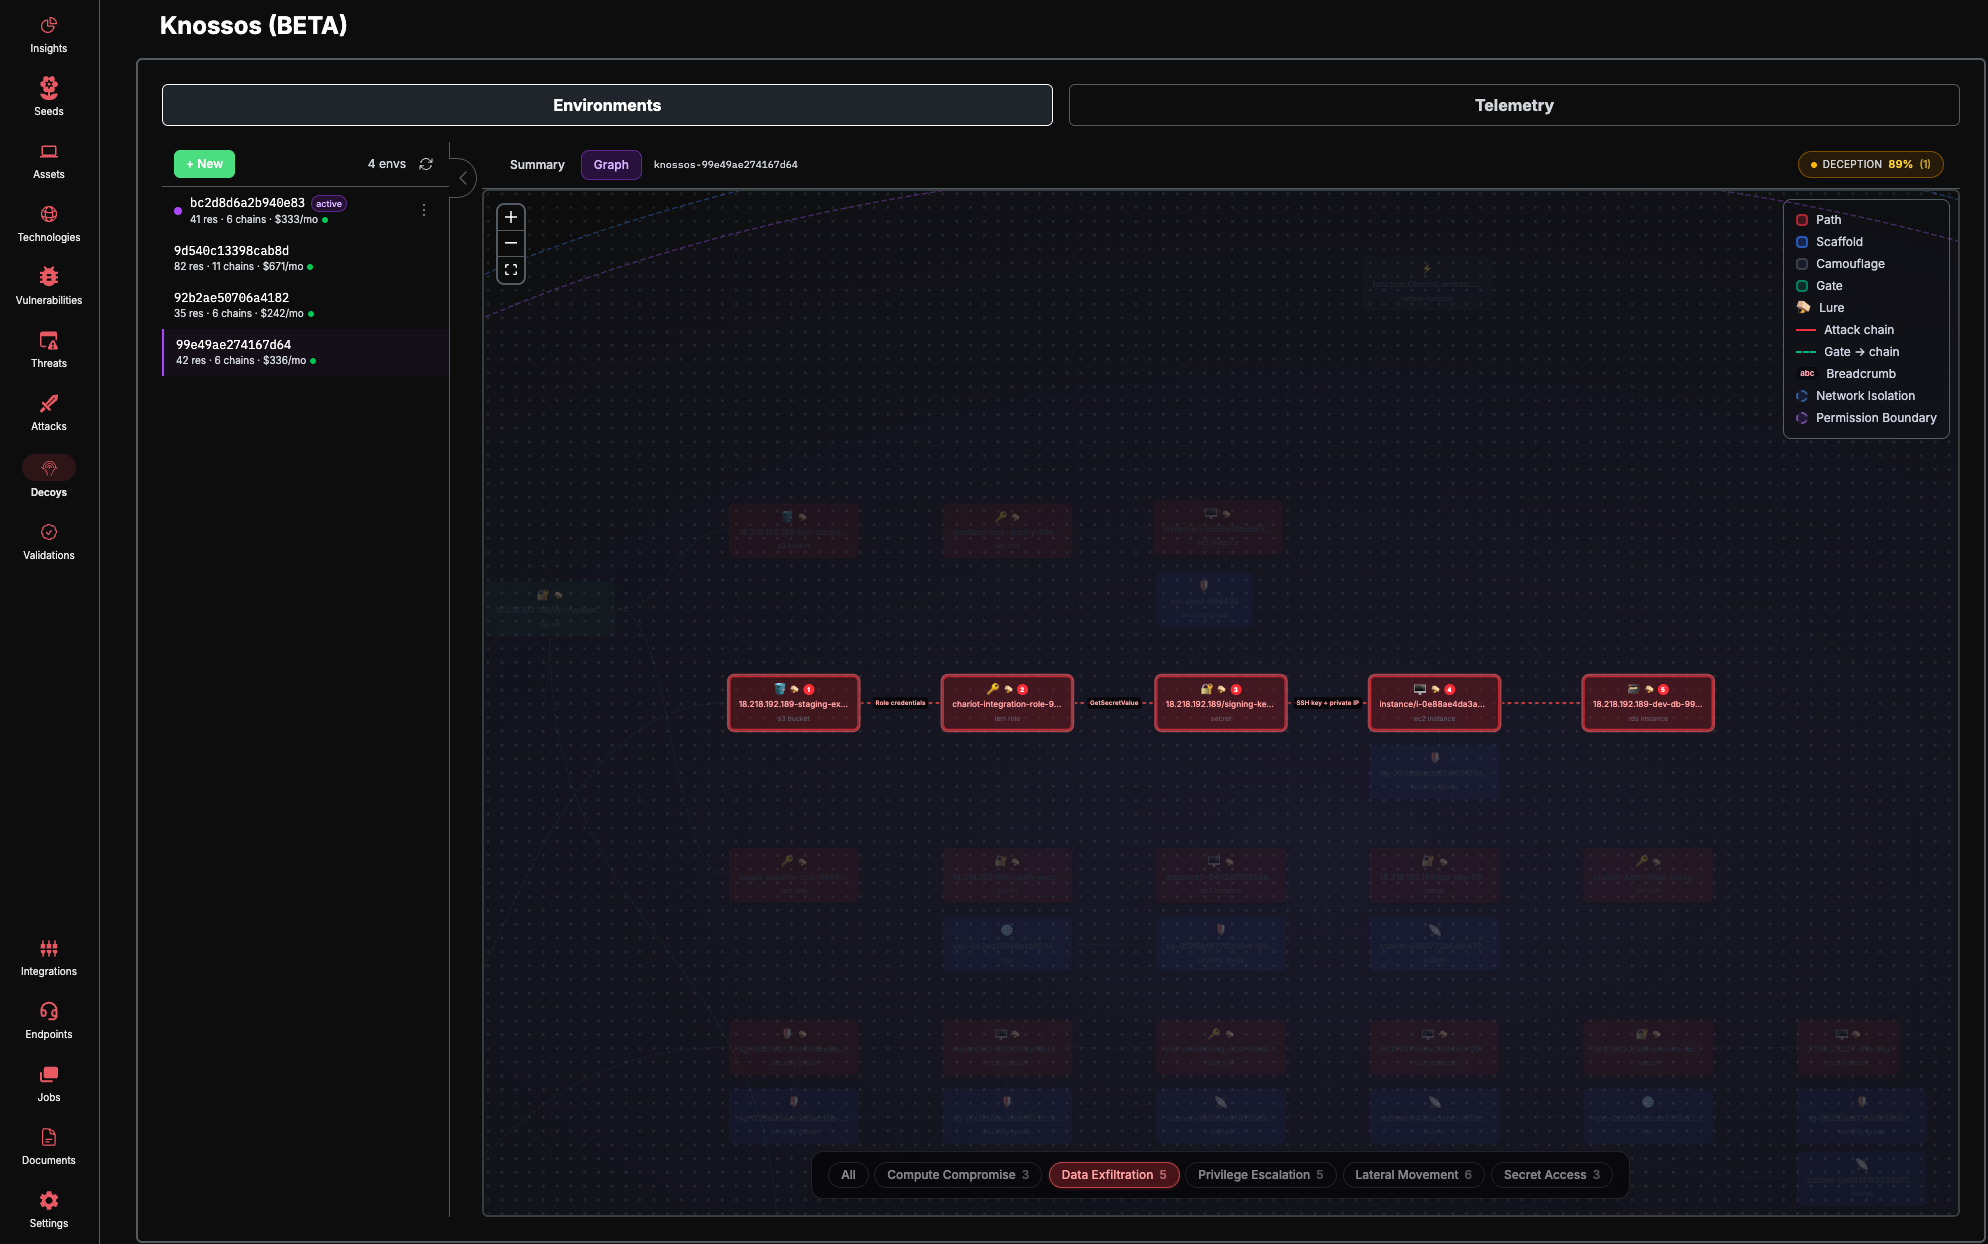
Interpreting the Graph View
The graph view renders the full topology of your deception environment using an interactive node-and-edge diagram.
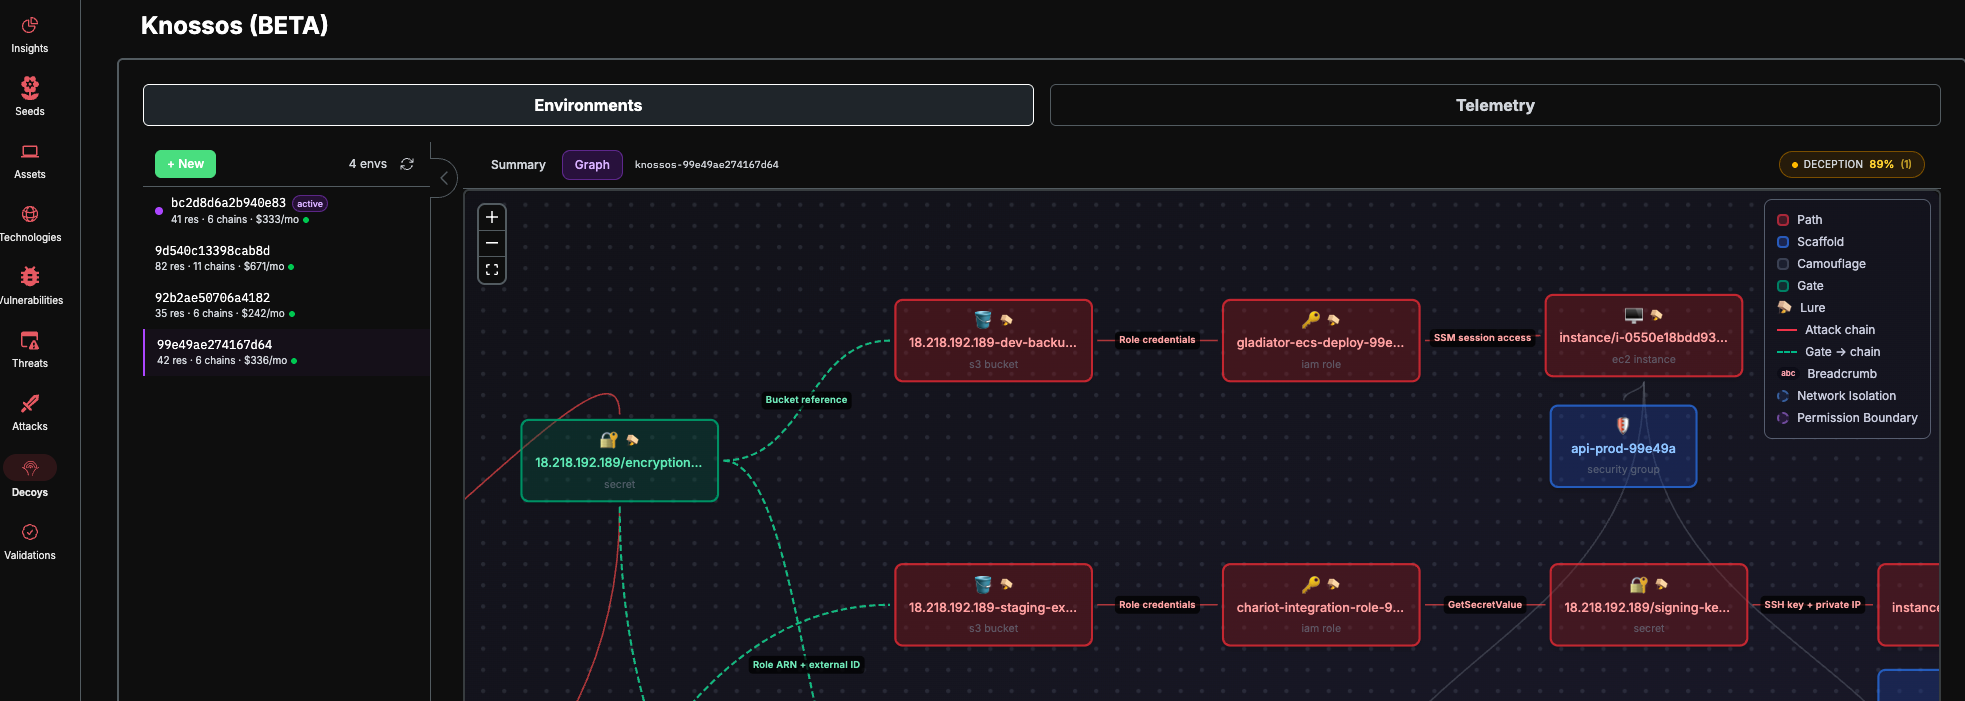
Node Colors
Each node represents a resource, colored by its role in the deception:
Node Annotations
🪤 — Resource hosts a lure (a breadcrumb pointing to another resource)
Numbered circle (red) — Step index when a trail is selected
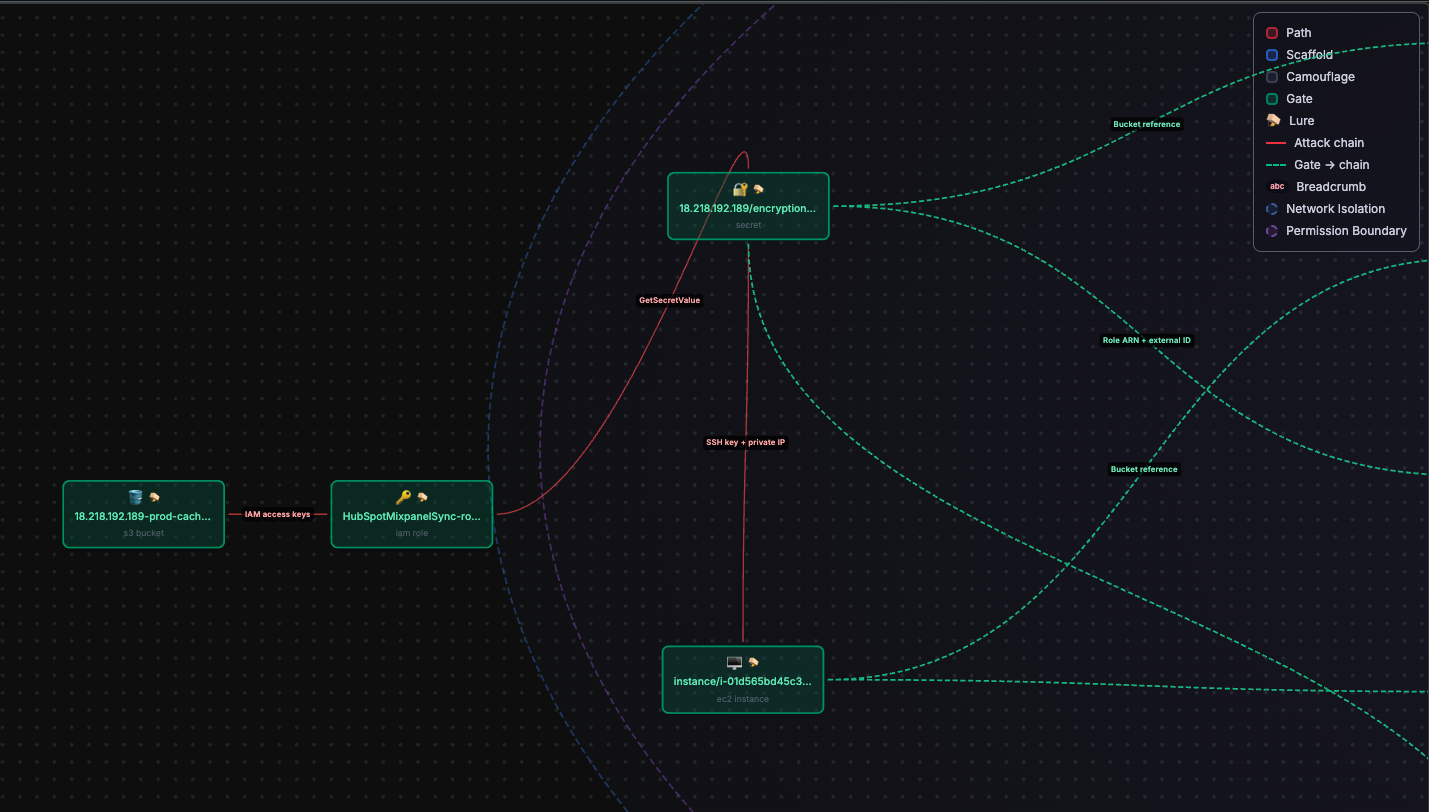
Edge Types
Breadcrumb Labels
Edges along attack chains are annotated with breadcrumb labels describing what the attacker discovers at each hop:
Role credentials — IAM access keys or assumable role ARNs
Secret reference — Secret name or ARN in Secrets Manager
SSM session access — Systems Manager session to a compute resource
Database credentials — RDS/DynamoDB connection strings
S3 bucket contents — Objects planted in decoy buckets
Isolation Layers
Dashed ellipses represent security boundaries:
Purple dashed circle — Permission boundary (IAM-enforced isolation)
Blue dashed circle — Network isolation (VPC/subnet boundary)
Trail Selector
At the bottom of the graph, pill-shaped buttons let you highlight individual attack chains by goal. Clicking a trail highlights its nodes and edges and auto-fits the view.
Controls
Pan: Click and drag, or scroll
Zoom: Mouse wheel, or zoom buttons (top-left)
Fit View: Automatically fits on load and when selecting a trail
Knossos Gate
The Knossos Gate is a bridge scenario where external-facing resources serve as entry points into the decoy environment. Gate resources sit outside the main decoy network and are designed to be discoverable by attackers performing external reconnaissance.
When a gate is present in the environment:
Gate nodes appear in emerald (green) in the graph view
Gate edges are dashed emerald lines connecting gate resources to attack chain entry points
Internal gates appear as a vertical column to the left of the chain entry points
External gates appear further left, outside the network isolation boundary
Gate interactions are instrumented like all other decoy resources — any touch generates a telemetry event.
Exporting and Deploying
Export HCL
From the environment row action menu, click Export HCL. This opens a guided 3-step modal:
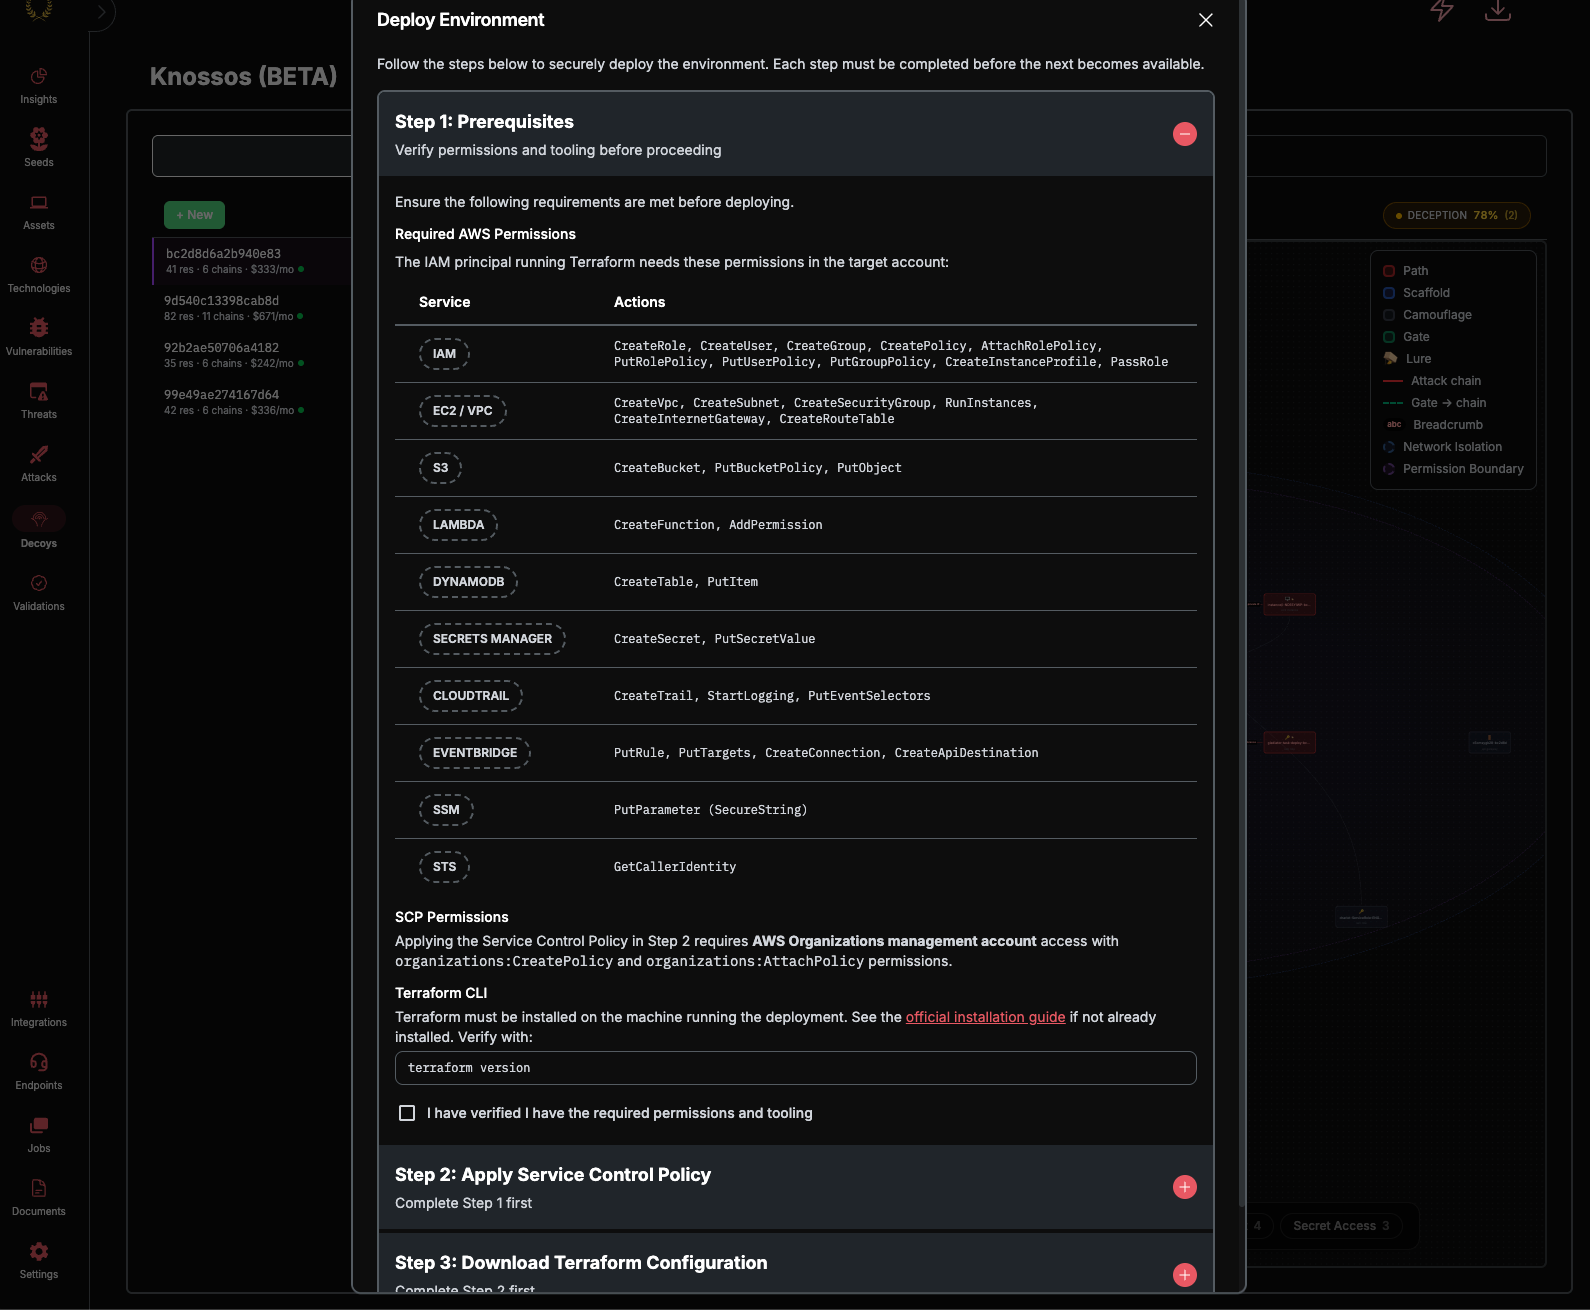
Step 1: Prerequisites
Verify that you have the required permissions and tooling in your target AWS account.
Required AWS Permissions:
Required Tooling:
Terraform CLI (
terraform versionto verify)AWS CLI (for SCP application)
Check the confirmation checkbox to proceed to the next step.
Step 2: Apply Service Control Policy
The Service Control Policy (SCP) is applied from your AWS management account to restrict the IAM roles in the deception environment. This is a critical safety mechanism that prevents decoy roles from accessing real production resources.
The modal provides:
A
sedcommand to replace the<ACCOUNT_ID>and<ORG_PATH>placeholders in the SCP document with your actual valuesThe full SCP policy JSON for review
An AWS CLI command to create the policy in your organization
An AWS CLI command to attach the policy to the target OU
You can copy the SCP JSON to clipboard or download it as {envId}-scp.json.
Check the confirmation checkbox after applying the SCP.
Step 3: Download Terraform Configuration
Once the SCP is in place, download the Terraform HCL file:
Click Download HCL — saves as
{envId}.tfReplace the
<ORG_PATH>placeholder in the downloaded file using the providedsedcommandRun the Terraform workflow:
terraform init
terraform validate
terraform plan -out=tfplan
terraform apply tfplan
The environment is now live in your AWS account.
How SCP Protection Works
All IAM roles in a Knossos environment are constrained by two complementary mechanisms:
Permission Boundary — Attached to every IAM role, limiting the maximum permissions the role can grant. From the attacker's perspective, roles appear fully permissive — but the boundary silently prevents any action outside the decoy environment.
Service Control Policy — Applied at the organizational unit level, providing an additional guardrail that restricts all principals in the target account to only the decoy resources.
This layered approach ensures that even if an attacker assumes a decoy role, they cannot pivot to real infrastructure.
Viewing the Budget
From the environment row action menu, click Budget to open the cost breakdown modal.
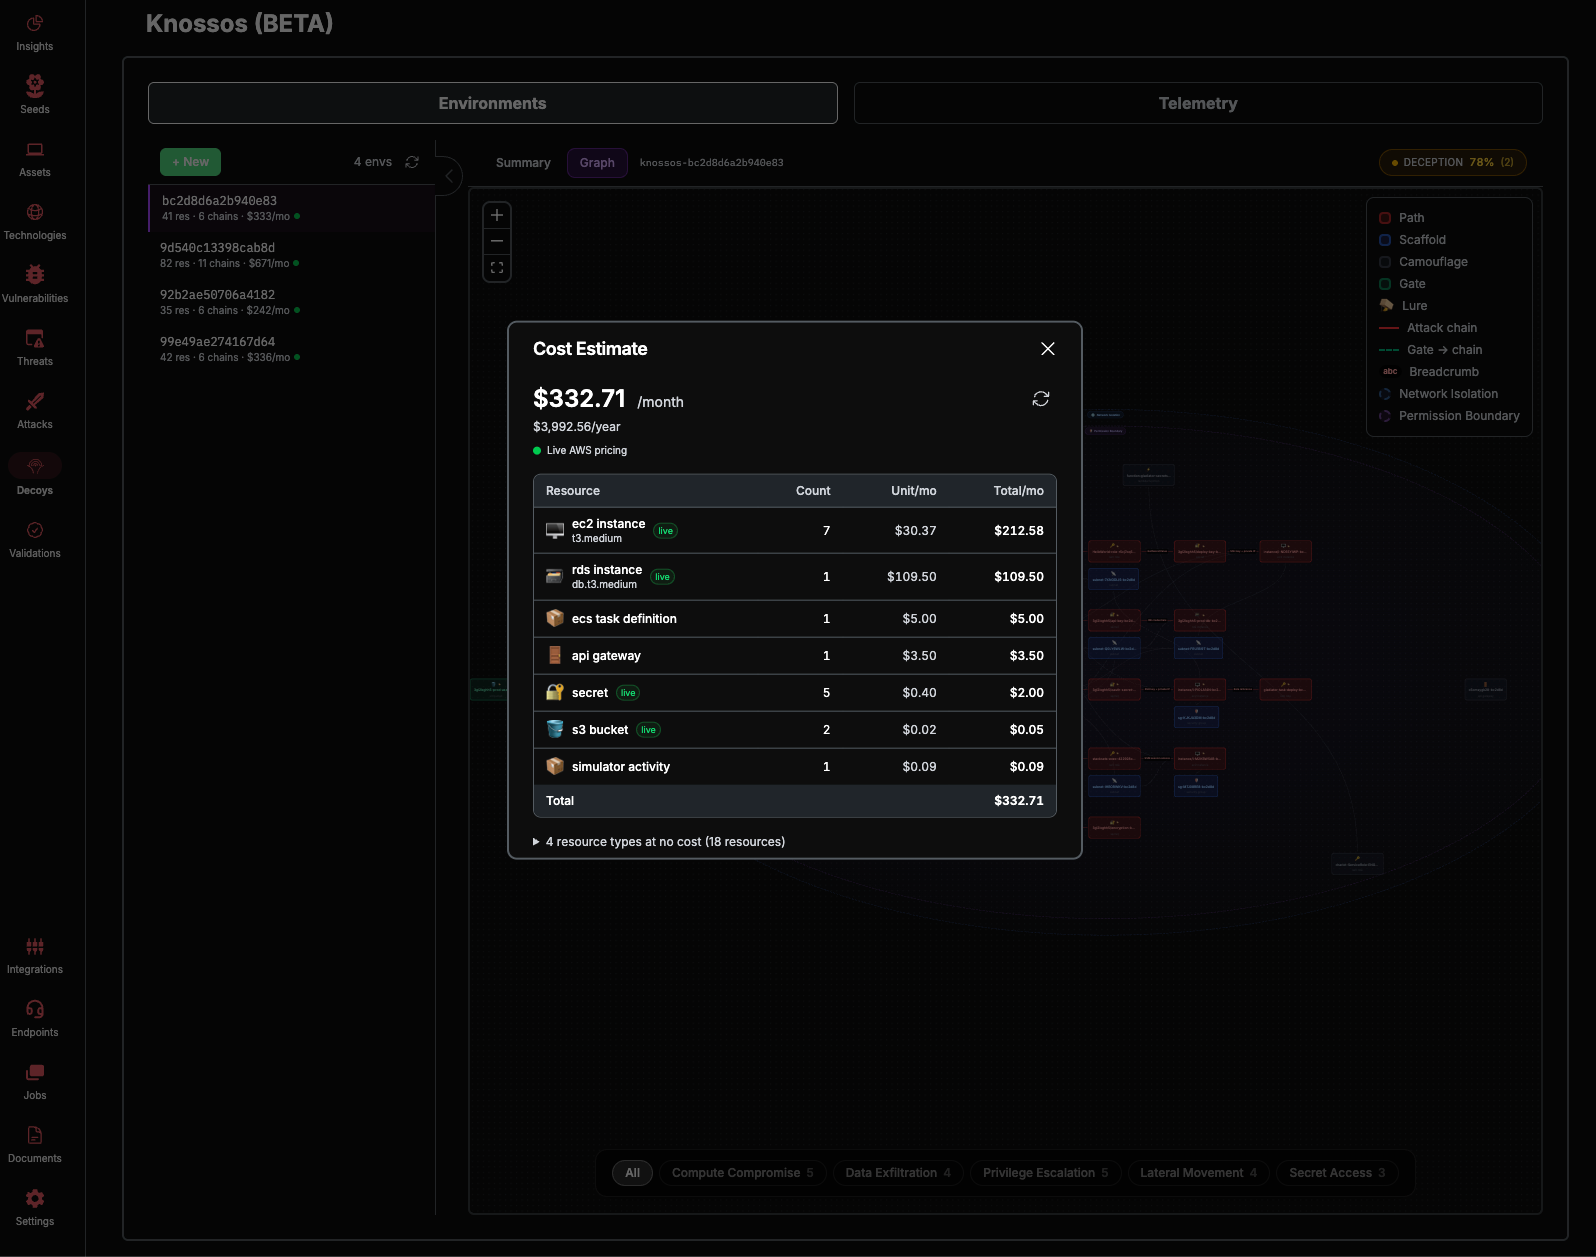
Cost Summary
The header shows:
Total Monthly — Estimated monthly cost (e.g.,
$12.45 /month)Total Annual — Annualized cost
Pricing indicator — Green dot = live AWS pricing; Yellow dot = estimated from published rates
Refresh button — Fetches current pricing from AWS (POST request)
Billable Resources Table
A detailed breakdown by resource type:
Resources with live pricing show a green "live" badge.
Free Resources
A collapsible section at the bottom lists resource types that incur no cost (e.g., IAM roles, security groups, SSM parameters). Shows the total count of free resources as a grid of small badges.
Telemetry
Switch to the Telemetry tab to monitor attacker activity in your deployed environment. Telemetry requires an active environment that is deployed and receiving events.
Telemetry data refreshes automatically every 30 seconds.
The Telemetry tab has three views:
Timeline
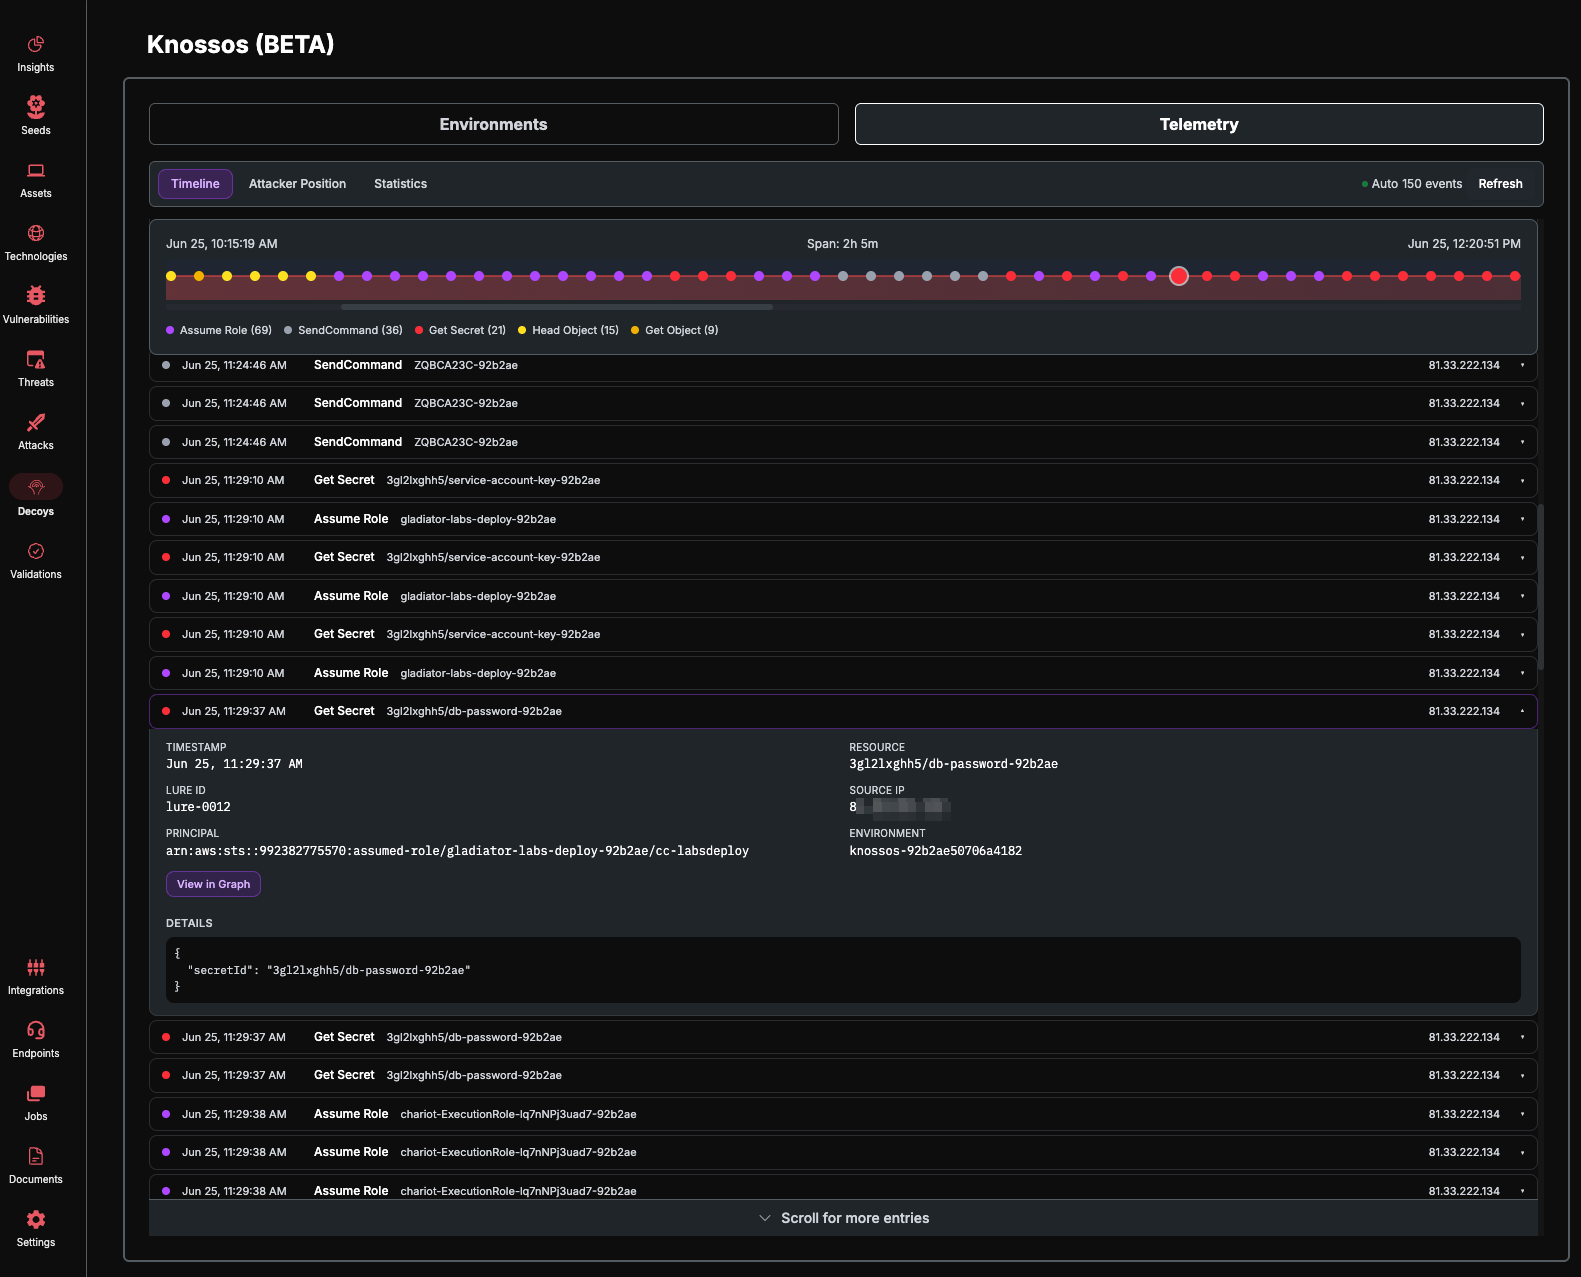
The timeline provides a chronological view of all telemetry events.
Timeline Bar
A horizontal scrollable bar at the top shows event density over time:
Colored dots represent individual events, colored by event type
Area curve (red gradient) shows event density
Click a dot to expand its details in the list below
The bar auto-scrolls to keep the focused event centered
Event Legend
Below the timeline bar, colored dots show event type counts:
Event List
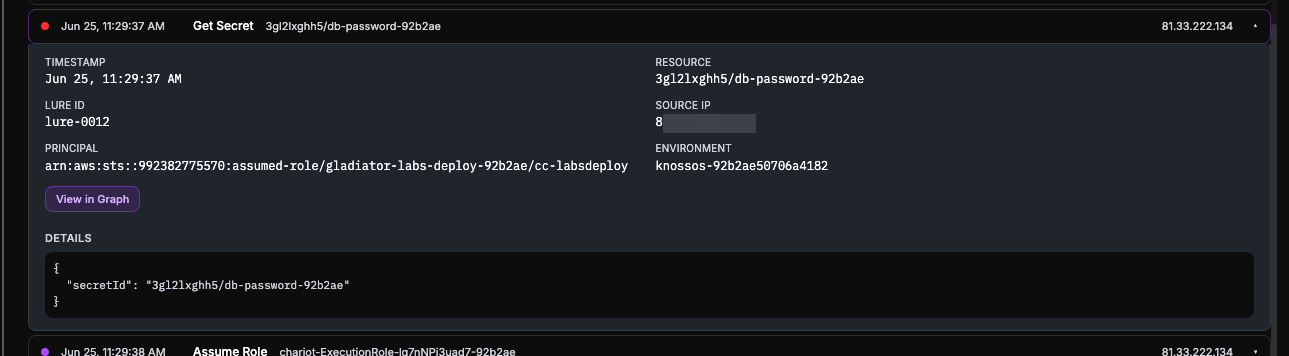
Events are shown in an accordion list. Each event card displays:
Header: Colored dot, timestamp, event type, resource name, source IP
Expanded details: Timestamp, resource, lure ID, source IP, principal, environment ID
View in Graph button (when applicable) — jumps to the Attacker Position view and highlights the resource
Raw JSON details (if available) — scrollable JSON block with full event data
The list supports infinite scroll — more events load automatically as you scroll down.
Attacker Position
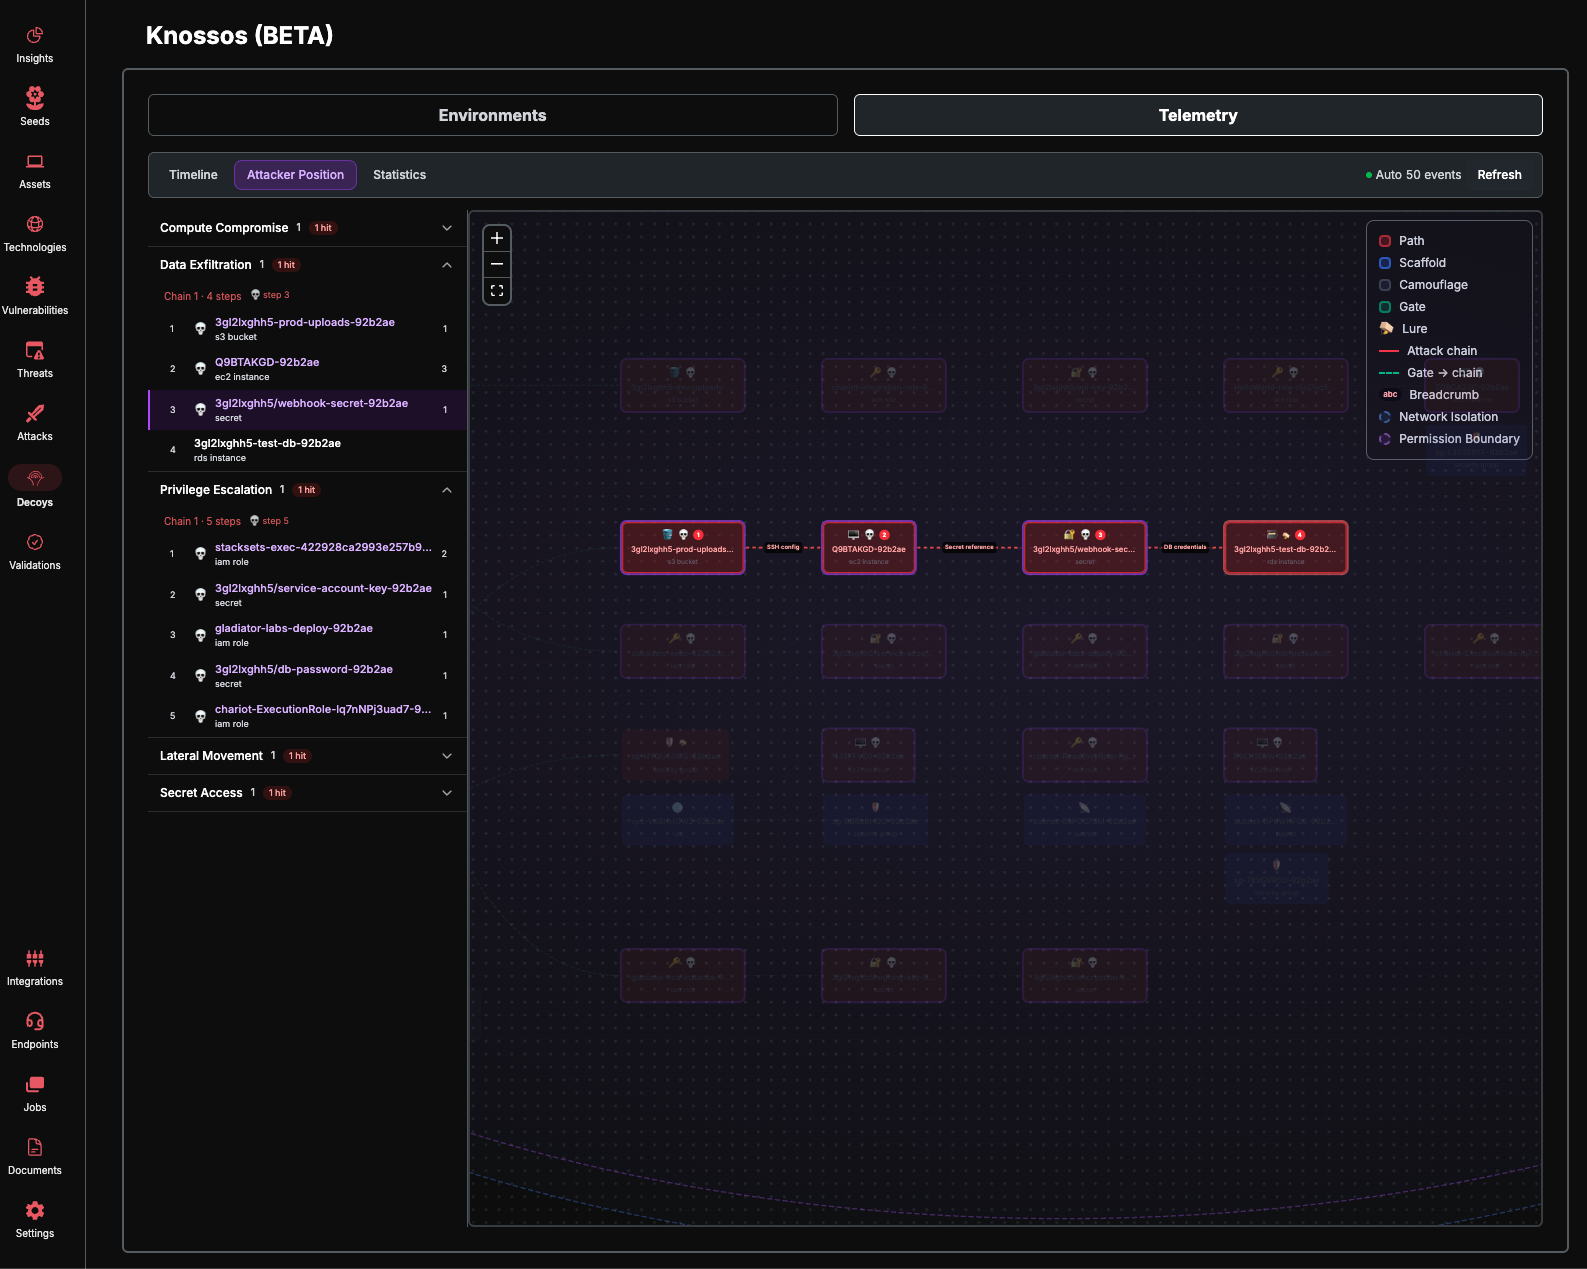
The attacker position view combines the attack chain structure with the graph visualization to show exactly where the attacker has been.
Left Panel — Attack Chain Accordion
Attack chains are grouped by goal (Data Exfiltration, Privilege Escalation, etc.). Each goal card shows:
Goal label and chain count
"X hit" badge if any chains in this goal have been touched
Expanding a goal reveals individual chains:
Chain header: "Chain N · M steps" with a 💀 indicator if any step is compromised
Step buttons: Click to highlight the resource in the graph
Event count: Number of events associated with each step
Right Panel — Graph View
The environment graph with compromised nodes marked:
💀 appears on nodes that have been touched by an attacker
Selecting a chain step in the left panel highlights the corresponding trail in the graph
Clicking View in Graph from the Timeline jumps here and highlights the relevant resource
Statistics
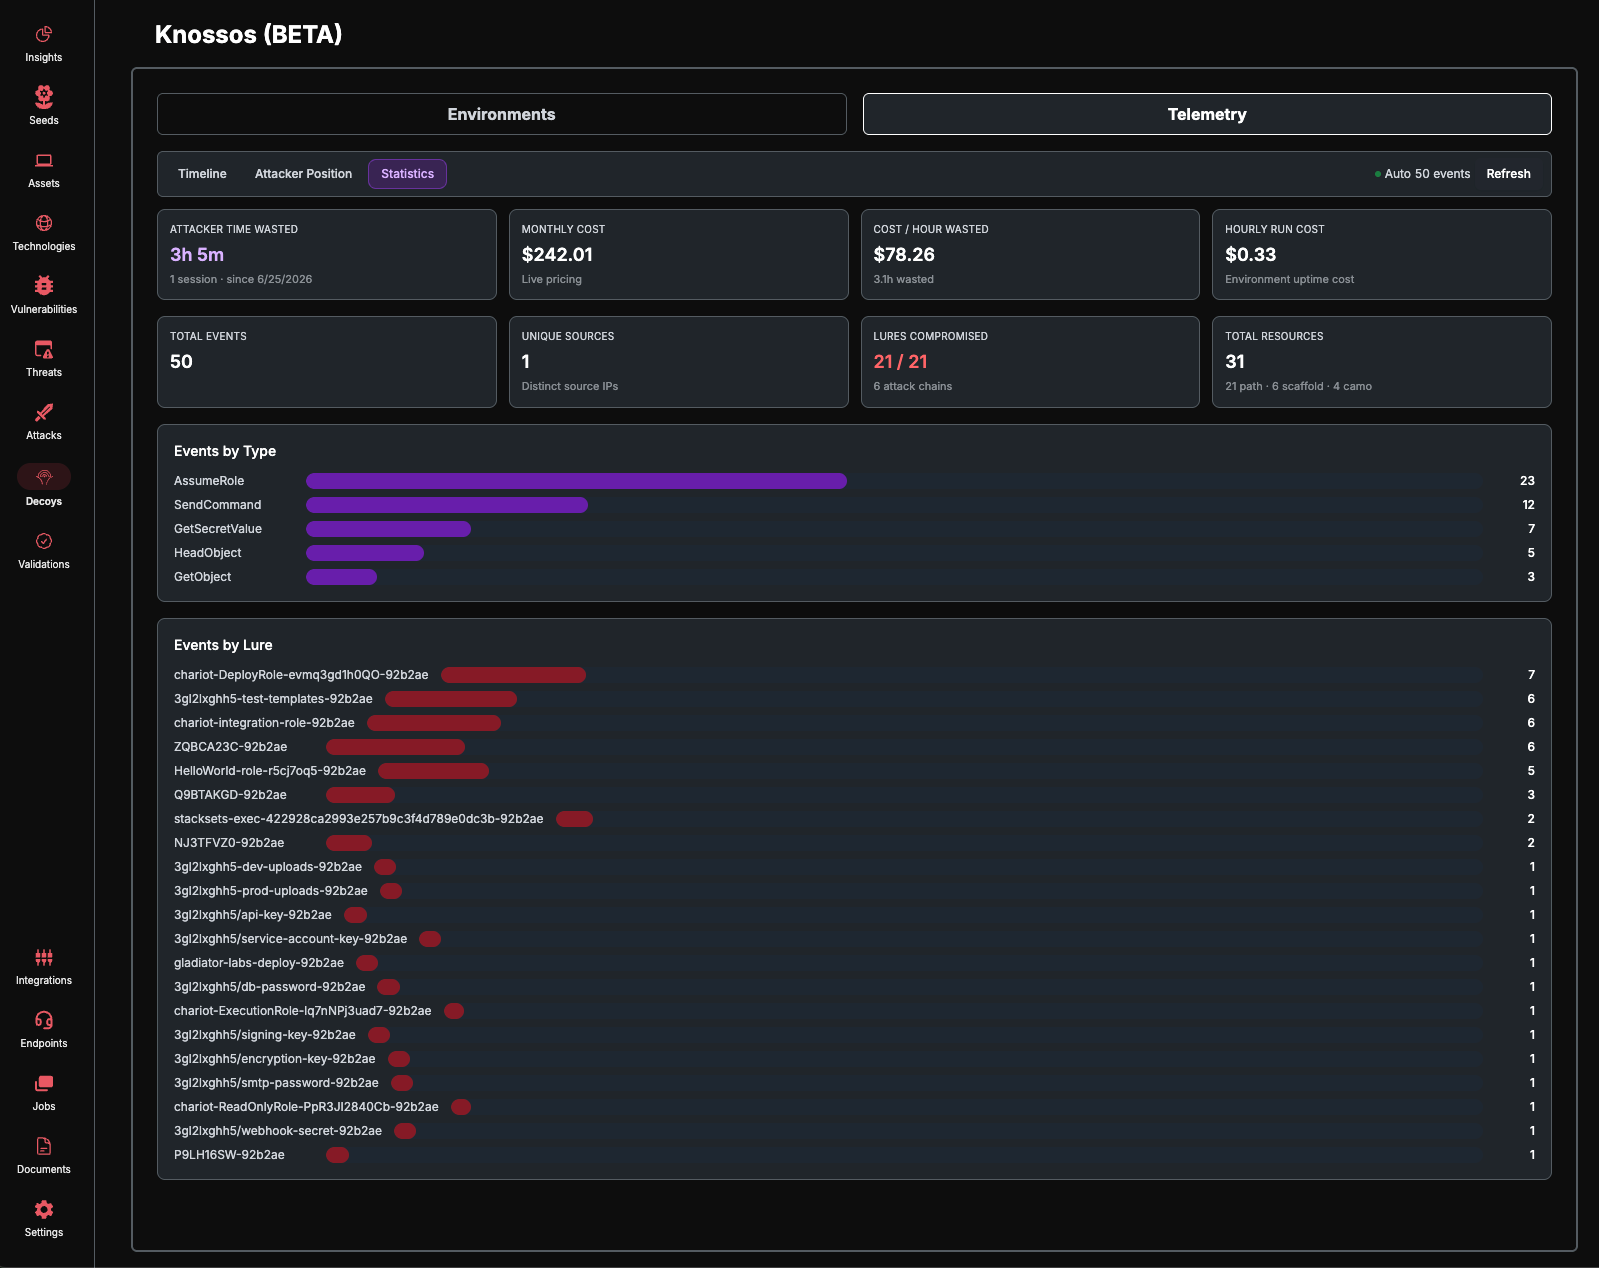
The statistics view provides aggregate metrics about attacker engagement and environment cost.
Attacker Impact (top row)
Environment Stats (second row)
Event Distribution Charts
Two horizontal bar charts at the bottom:
Events by Type — Sorted by count, showing which types of events are most common
Events by Lure — Sorted by count, showing which lure resources are most frequently touched
Environment Management
Row Actions
Each environment in the left sidebar has a context menu with the following actions:
Multiple Environments
You can generate and maintain multiple environments simultaneously. This is useful for:
A/B testing different attack chain configurations
Rotating environments periodically to prevent attacker adaptation
Cost comparison between configurations with different resource caps
Staging a new environment before making it active
Only one environment can be active at a time for telemetry purposes.